A star exploded once. Astronomers watched it appear again a year later, right where they said it would. The Moon is shrinking, and nobody had to measure it with a tape. A camera found paint on the Parthenon that no human eye could see.
None of those is a magic trick. Behind each one sits the most important question in science: how do scientists know? Not what they found, but how. Pick a mystery below and follow the evidence, one step at a time.
Choose a Mystery
- Are space photos real, or are they edited?
- Which planet has the most moons, and how do we know the count is right?
- Is the Moon really shrinking?
- How does a Mars rover drive itself?
- Why is NASA sending a drone to Titan?
- Why do Jupiter and Saturn have such different polar storms?
- Why do Hubble and Webb make the same nebula look so different?
- How can astronomers measure a star they can never visit?
- Did a star really explode once and appear again?
- How do scientists know these lakes are breathing out ancient carbon?
- How can a camera find ancient paint nobody can see?
New to space pictures? Start with the Space Image Decoder →
How Do Scientists Know? The Four Steps
Every case on this page uses the same four steps, the skeleton of almost any discovery.
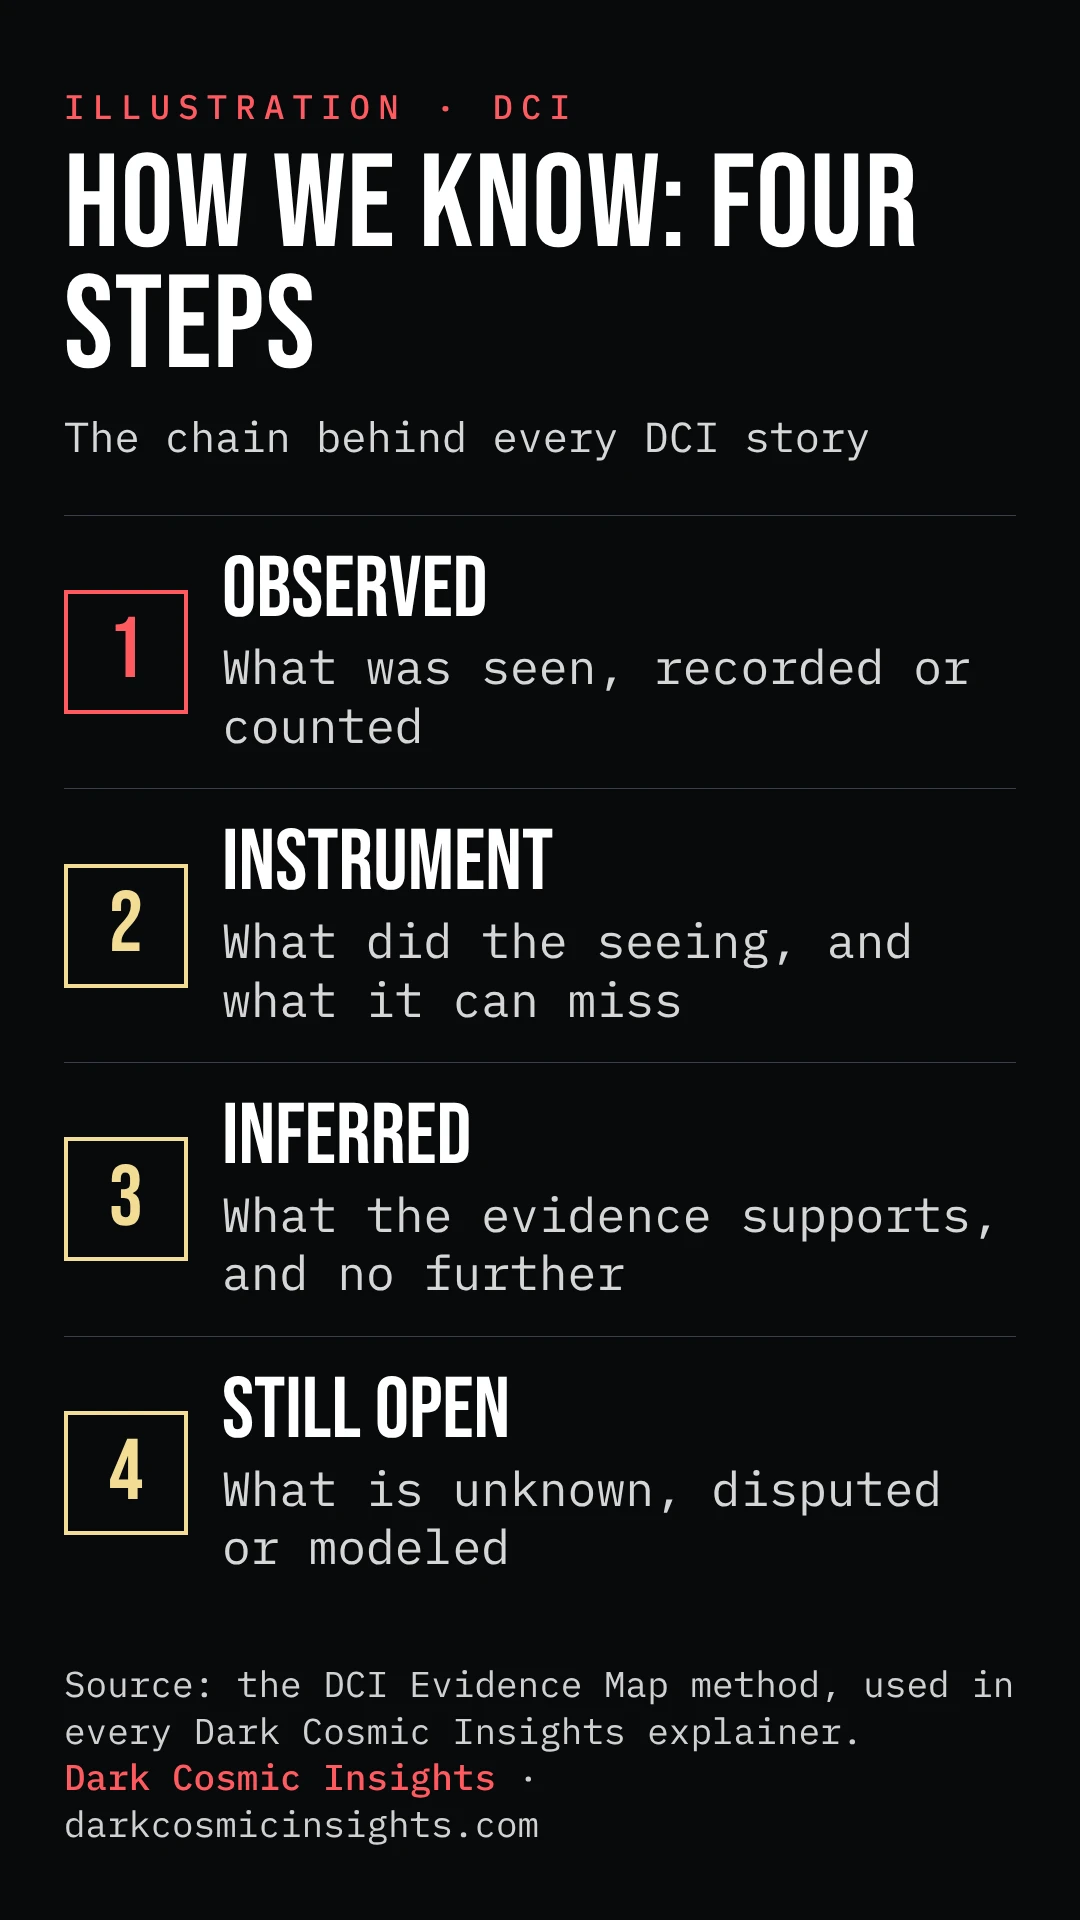
1. Observed. What was actually seen, recorded or counted. This is the raw fact: four images of a supernova, 28 shallow moonquakes, a faint glow at 910 nanometers. An observation is not yet an explanation.
2. Instrument. What did the seeing. Knowing the instrument tells you what kind of light or signal was captured, and what it could have missed.
3. Inferred. What scientists conclude from the observation. This is where reasoning, physics and sometimes models come in. A good inference says how far the evidence reaches, and no further.
4. Still open. What is still unknown, disputed or model-dependent. Every honest result has an edge, and finding it is how you know the science is being straight with you.
How to read a case card
Each card splits its story into those four parts, because one story can hold a direct observation, a modeled number and an open question at once. Watch for “modeled” inside Inferred: it means calculated from observations, not measured directly. Some cards add a line for something only planned or demonstrated, so it never gets mixed up with what has been done. Every card ends with a link to the full article and its Evidence Map.
Start Here: Read Any Space Image
Most space news arrives as an image, and the image is where most confusion starts. Our Space Image Decoder lists the six labels observatory captions commonly use, what each usually means, and what to check.
| Caption label | What it usually tells you | What to check |
|---|---|---|
| Natural color / approximately true color | The display aims to resemble visible-light colors | Filters, calibration and caption qualifications |
| Enhanced color | Brightness or color differences were emphasized | What was enhanced, and why |
| False color / representative color | Display colors stand for chosen wavelengths or measured quantities | The color key and filter assignments |
| Composite or mosaic | Several observations or tiles were combined | Instruments, dates, wavelengths, and how they were joined |
| Simulation | A model calculated a scene or behavior | Assumptions, inputs, and the observations used to test it |
| Artist’s concept / illustration | An artist depicts a possible scene | Which details are measured and which are illustrative |
The labels can overlap, so one image may carry more than one. The guide pairs the decoder with a five-step check: find the original release, identify the image type, check the instrument and wavelengths, check the dates, and match the picture to the claim.
Open the Space Image Decoder →
Are space photos real, or are they edited?
- Observed: Space telescope cameras record one band of light at a time through a filter, and each exposure is a grid of brightness values.
- Instrument: Webb’s NIRCam (about 0.6 to 5 micrometers, 29 filters) and MIRI (about 5 to 28 micrometers, 9 filters), plus Hubble for visible light.
- Inferred: Most space photos are real but processed. They are built from real light recorded by real instruments, and false color does not mean fake.
- Still open: Colors may not match what the eye would see, and any image without its original source cannot be vouched for.
Read the full story: Are Space Photos Real? Natural Color, False Color and Artist’s Concepts →
Planets & Moons
Which planet has the most moons, and how do we know the count is right?
- Observed: As of November 7, 2026, Saturn has 293 known moons and Jupiter has 115, according to NASA JPL’s list. Each counted moon has a tracked orbit.
- Instrument: Ground telescopes including Subaru and the Canada-France-Hawaii Telescope, with orbits confirmed through the IAU’s Minor Planet Center.
- Inferred: Saturn has the most known moons today, but a moon count is a dated snapshot, not a permanent fact.
- Still open: Whether Saturn stays ahead depends on future surveys, and the IAU has no formal definition of a moon.
Read the full story: Which Planet Has the Most Moons? Saturn vs. Jupiter, Counted and Dated →
Is the Moon really shrinking?
- Observed: An October 2026 study counted more than 10,000 young faults, including over 8,900 lobate scarps, cutting across small, fresh craters. Apollo seismometers recorded 28 shallow moonquakes from 1969 to 1977.
- Instrument: The Lunar Reconnaissance Orbiter’s camera (LROC) imaged the faults. Apollo-era seismometers on the surface recorded the quakes.
- Inferred: The Moon’s interior is cooling, so its crust contracts and cracks, and some faults may still slip and shake the surface. The total shrinkage, about 45 meters in radius, is a modeled figure, not a direct measurement.
- Still open: The current shrinking rate, which faults are active today, and how strong future shaking could be at a lunar base. The popular idea that you can see the Moon getting smaller is not supported.
Read the full story: Why Is the Moon Shrinking? Moonquakes and the Cracks That Reveal It →
How does a Mars rover drive itself?
- Observed: Radio signals take about 3 to 22 minutes one way, so live driving from Earth is impossible. NASA reports that more than 90% of Perseverance’s distance has been driven by its own software. Its best single sol was 347.69 meters on April 3, 2023, and on October 11, 2026, its total of 45.22 kilometers passed Opportunity’s off-world record of 45.16 kilometers.
- Instrument: Stereo navigation cameras build a 3D ground map, ENav weighs about 1,700 candidate paths and picks a safe one, and visual odometry tracks how terrain shifts between frames.
- Inferred: Humans set goals and waypoints, and the rover chooses the path between them. That split is what lets it cover ground despite the delay.
- Demonstration, not routine: On December 8 and 10, 2025, AI generated the waypoints for two drives of 210 and 246 meters, using orbital images and slope data. Engineers tested the commands on JPL’s digital twin on Earth before sending them, and the rover’s own software did the driving on Mars. It was a two-drive demonstration, not a new everyday mode. JPL release
- Still open: Whether AI route planning becomes routine. NASA has not said it will, and kilometers-per-day driving is still a goal, not something achieved.
Read the full story: How Do Mars Rovers Navigate? Inside Perseverance’s Self-Driving System →
Why is NASA sending a drone to Titan?
- Observed: Titan has thick nitrogen air at about 1.5 times Earth’s sea-level pressure, and lakes and seas of liquid methane and ethane, mainly near the north pole.
- Instrument: ESA’s Huygens probe landed on January 14, 2005, and worked on the surface for 72 minutes. NASA’s Cassini made more than 100 targeted flybys before the mission ended in 2017.
- Inferred: Dense air and weak gravity make flight easier on Titan than on Earth, which is why a rotorcraft makes sense there.
- Planned, not yet flown: Dragonfly is a future mission. Its launch window is July 5 to 25, 2028, with arrival planned for late 2034. Its goal is prebiotic chemistry and habitability, not searching for life itself. These dates are plans and could change.
- Still open: A 2025 study disputes a global underground ocean and argues for slushy ice with pockets of liquid. There is no evidence on life either way.
- Image credit: Huygens, First Color View of Titan’s Surface, PIA07232 (NASA/JPL/ESA/University of Arizona)
Read the full story: NASA’s Dragonfly Mission to Titan: Why We’re Sending a Drone to Saturn’s Moon →
Why do Jupiter and Saturn have such different polar storms?
- Observed: Jupiter’s north pole has eight cyclones around a central one, while Saturn’s north pole has one vortex inside a six-sided jet stream.
- Instrument: Juno’s JIRAM infrared camera and JunoCam at Jupiter, with Voyager, Cassini and Hubble’s OPAL program at Saturn.
- Inferred: A 2026 MIT model links the difference to how soft each vortex’s base is. That is a modeled explanation, which the article calls a strong lead, not a final answer.
- Still open: Nobody knows for certain why the planets differ, why the hexagon has exactly six sides, or how deep the cyclones go.
Stars & Galaxies
Why do Hubble and Webb make the same nebula look so different?
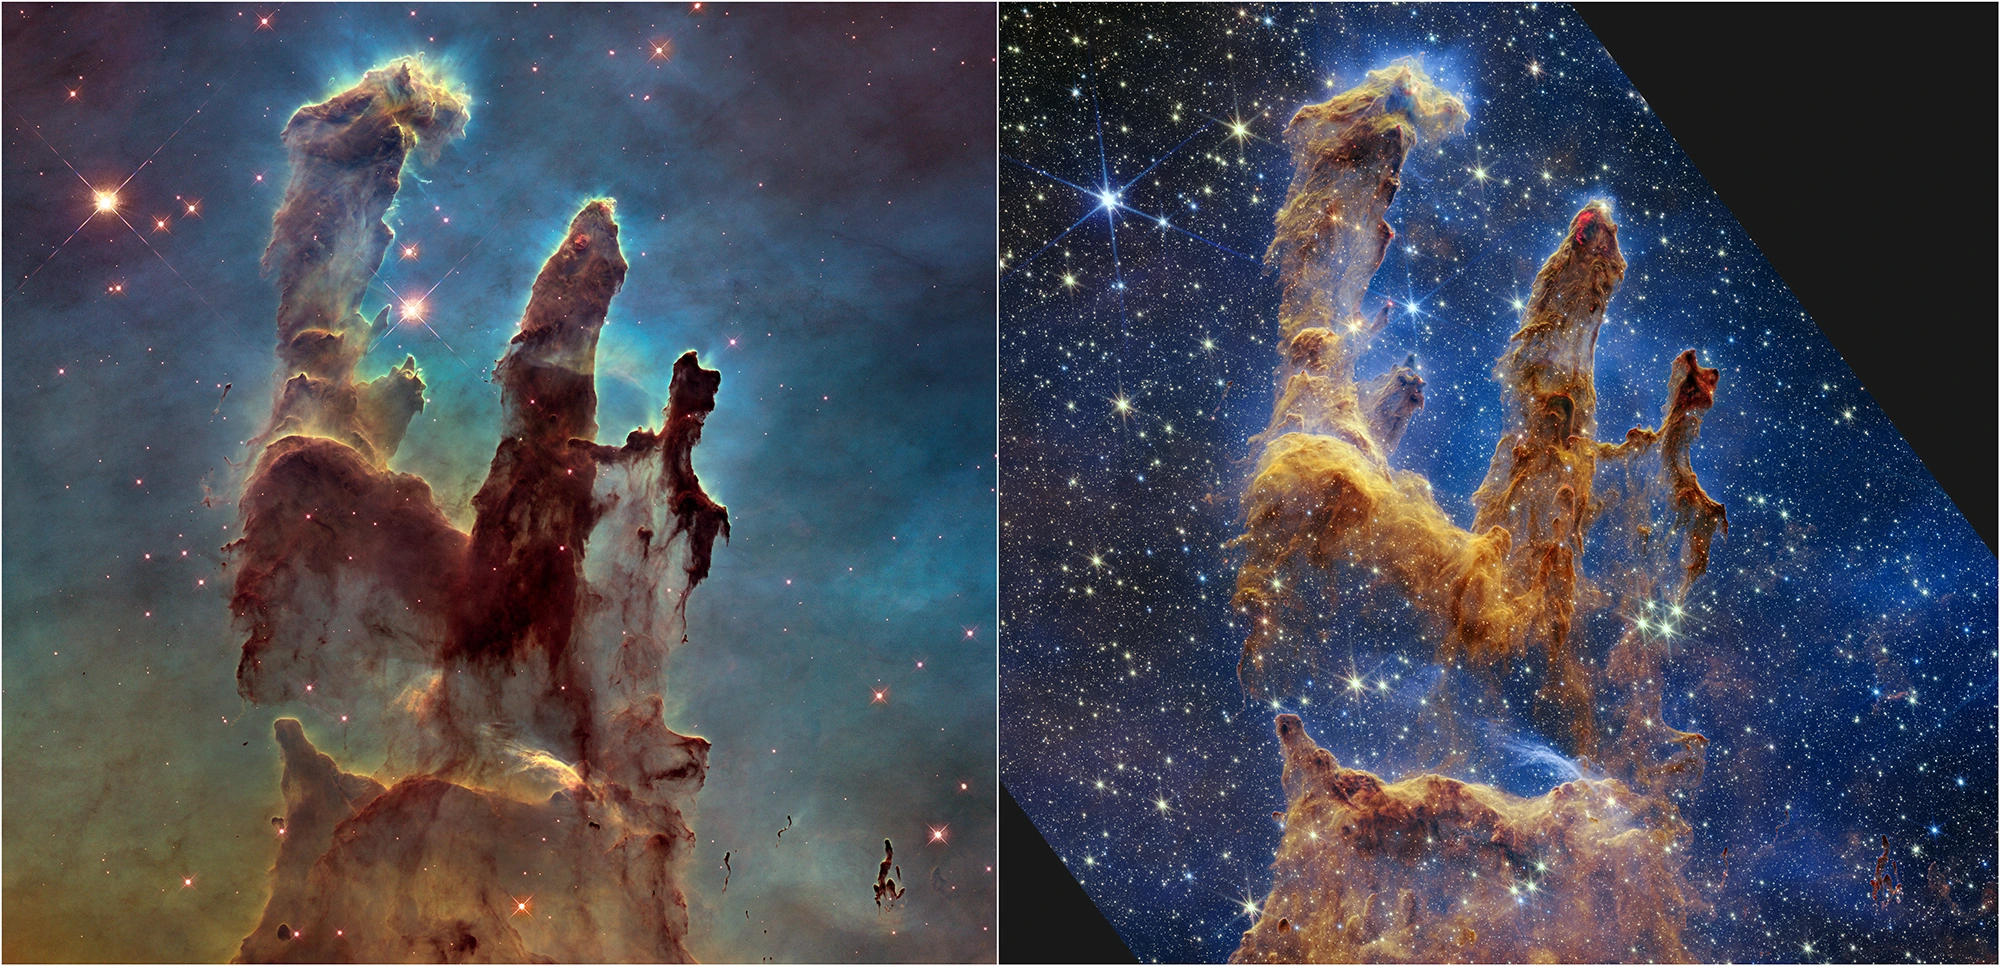
- Observed: Three separate looks at the Pillars of Creation. In 1995, Hubble took the famous visible-light image. In 2014, Hubble reshot the pillars in visible and near-infrared light (released January 2015). In 2022, Webb imaged them in near-infrared (October) and mid-infrared, revealing red newborn stars along the pillar edges that dust hides in the Hubble views.
- Instrument: 1995: Hubble’s Wide Field and Planetary Camera 2 (WFPC2). 2014: Hubble’s Wide Field Camera 3 (WFC3), which covers about 0.2 to 1.7 micrometers. 2022: Webb’s NIRCam (about 0.6 to 5 micrometers) and MIRI (out to about 28 micrometers).
- Inferred: Nothing about the pillars suddenly changed. The telescopes see different kinds of light, and infrared passes through dust more easily than visible light.
- Still open: Whether the pillars have already been destroyed is disputed, the dramatic differences between the images come mainly from wavelength, though smaller real changes have been measured (between 1995 and 2014 one jet stretched about 60 billion miles farther into space, per NASA), and even Webb cannot see through the densest dust.
- Image credits: 1995 Hubble WFPC2 image (NASA, ESA, STScI, J. Hester and P. Scowen) · 2014 Hubble WFC3 image (NASA, ESA, Hubble Heritage Team) · 2022 Webb NIRCam and MIRI composite (NASA, ESA, CSA, STScI)
Read the full story: Hubble vs. Webb: Why the Same Pillars of Creation Look So Different →
How can astronomers measure a star they can never visit?
- Observed: Nearby stars shift slightly against the background as Earth orbits the Sun, and starlight carries color and spectral lines.
- Instrument: Parallax from Hipparcos and Gaia, spectroscopy for temperature and composition, and interferometers such as CHARA and ALMA for a few giant stars.
- Inferred: Distance, brightness, temperature, size, mass and age can all be worked out from starlight, each step building on the one before.
- Still open: Every number has an error bar, and a lone star’s age can be off by a billion years or more.
Read the full story: How Astronomers Measure Stars: Distance, Size, Mass and Age, Explained →
Did a star really explode once and appear again?
- Observed: In November 2014, Hubble caught four images of one supernova, then detected a new image near the predicted spot on December 11, 2015.
- Instrument: The Hubble Space Telescope, looking through the galaxy cluster MACS J1149.6+2223, which bends light by gravitational lensing.
- Inferred: The star did not explode again. Light from one explosion took several routes and arrived at different times, and the new image appeared near where models predicted.
- Still open: Mass maps depend on models, Refsdal did not settle the Hubble tension, and future reappearance dates can change.
Read the full story: SN Refsdal: The Star That Exploded Once and Appeared Again →
Earth & Ancient Worlds
How do scientists know these lakes are breathing out ancient carbon?
- Observed: Dissolved inorganic carbon in Congo’s Lake Mai Ndombe dates to about 2,170 radiocarbon years, and in Lake Tumba to about 3,515.
- Instrument: Radiocarbon dating by accelerator mass spectrometry, which counts individual carbon-14 atoms, combined with carbon-13 analysis.
- Inferred: The water is young but part of its carbon is not. Mixing models estimate that ancient peat supplies about 39% to 40% of it, a modeled share rather than a direct count.
- Still open: How old carbon reaches the lakes, and whether the leak is long-standing and natural or a recent change. There is no evidence of collapse.
How can a camera find ancient paint nobody can see?
- Observed: Under visible light, Egyptian blue glows in the near-infrared, peaking at about 910 nanometers, beyond human vision at about 700 nanometers. The glow has turned up on the Parthenon sculptures and in Renaissance paintings.
- Instrument: Visible-induced luminescence (VIL) imaging with an infrared-sensitive camera, plus modified night-vision goggles, with results checked by lab tests such as XRF and Raman.
- Inferred: Where lab tests confirm it, the glow shows the Parthenon sculptures were painted, and that the pigment was still in use in the Renaissance.
- Still open: A glow alone is a strong clue, not proof, since Han blue and Han purple glow too. No glow does not mean an object was never painted.
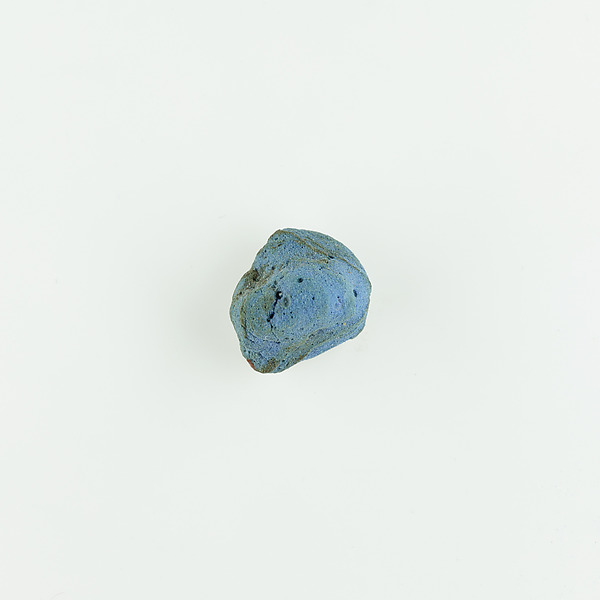
- Object credit: Lump of Blue Paste, Tomb of Senenmut, about 1473 to 1458 BCE, accession 36.3.202 (The Metropolitan Museum of Art)
Read the full story: Egyptian Blue Infrared Glow: How Scientists Find Ancient Paint You Can’t See →
New Explainers
Our newest explainers, each built on the same four steps.
- Why Is Pluto Not a Planet?: The 2006 vote and the debate
- What Is the Hottest Planet?: Why Venus beats Mercury
- How Cold Is Space?: The three temperatures of space
- Life Cycle of a Star: How birth mass shapes a star’s ending
- How Many Moons Does Jupiter Have?: A volcano moon, two likely ocean moons and a captured swarm
- How Many Moons Does Mars Have?: One moon measured falling, one expected to drift away
- Types of Galaxies: The tuning fork, and why it isn’t a timeline
- How Many Moons Does Saturn Have?: Enceladus’s ocean, Titan and hundreds of small moons
- How Many Moons Does Neptune Have?: Triton’s backwards orbit and what models say about its future
- Why Don’t Mercury and Venus Have Moons?: The Sun’s pull, slow spins and the moons that never held up
- How Many Moons Does Uranus Have?: Shakespeare’s moons, a sideways planet and a mission still in planning
- What Is the Biggest Planet?: Jupiter, tiny Mercury and why giant planets stop growing
- What Is a Nebula?: The five types, and how stars and nebulae recycle each other
- How Old Is the Universe?: Three cosmic clocks and the Hubble tension
- What Is a Black Hole?: How astronomers see something that gives off no light
- What Is Dark Matter?: The evidence, the candidates and the searches so far
- What Is Tidal Locking?: Why the Moon shows one face
- Why Is Neptune Blue?: Methane, haze and a Voyager color twist
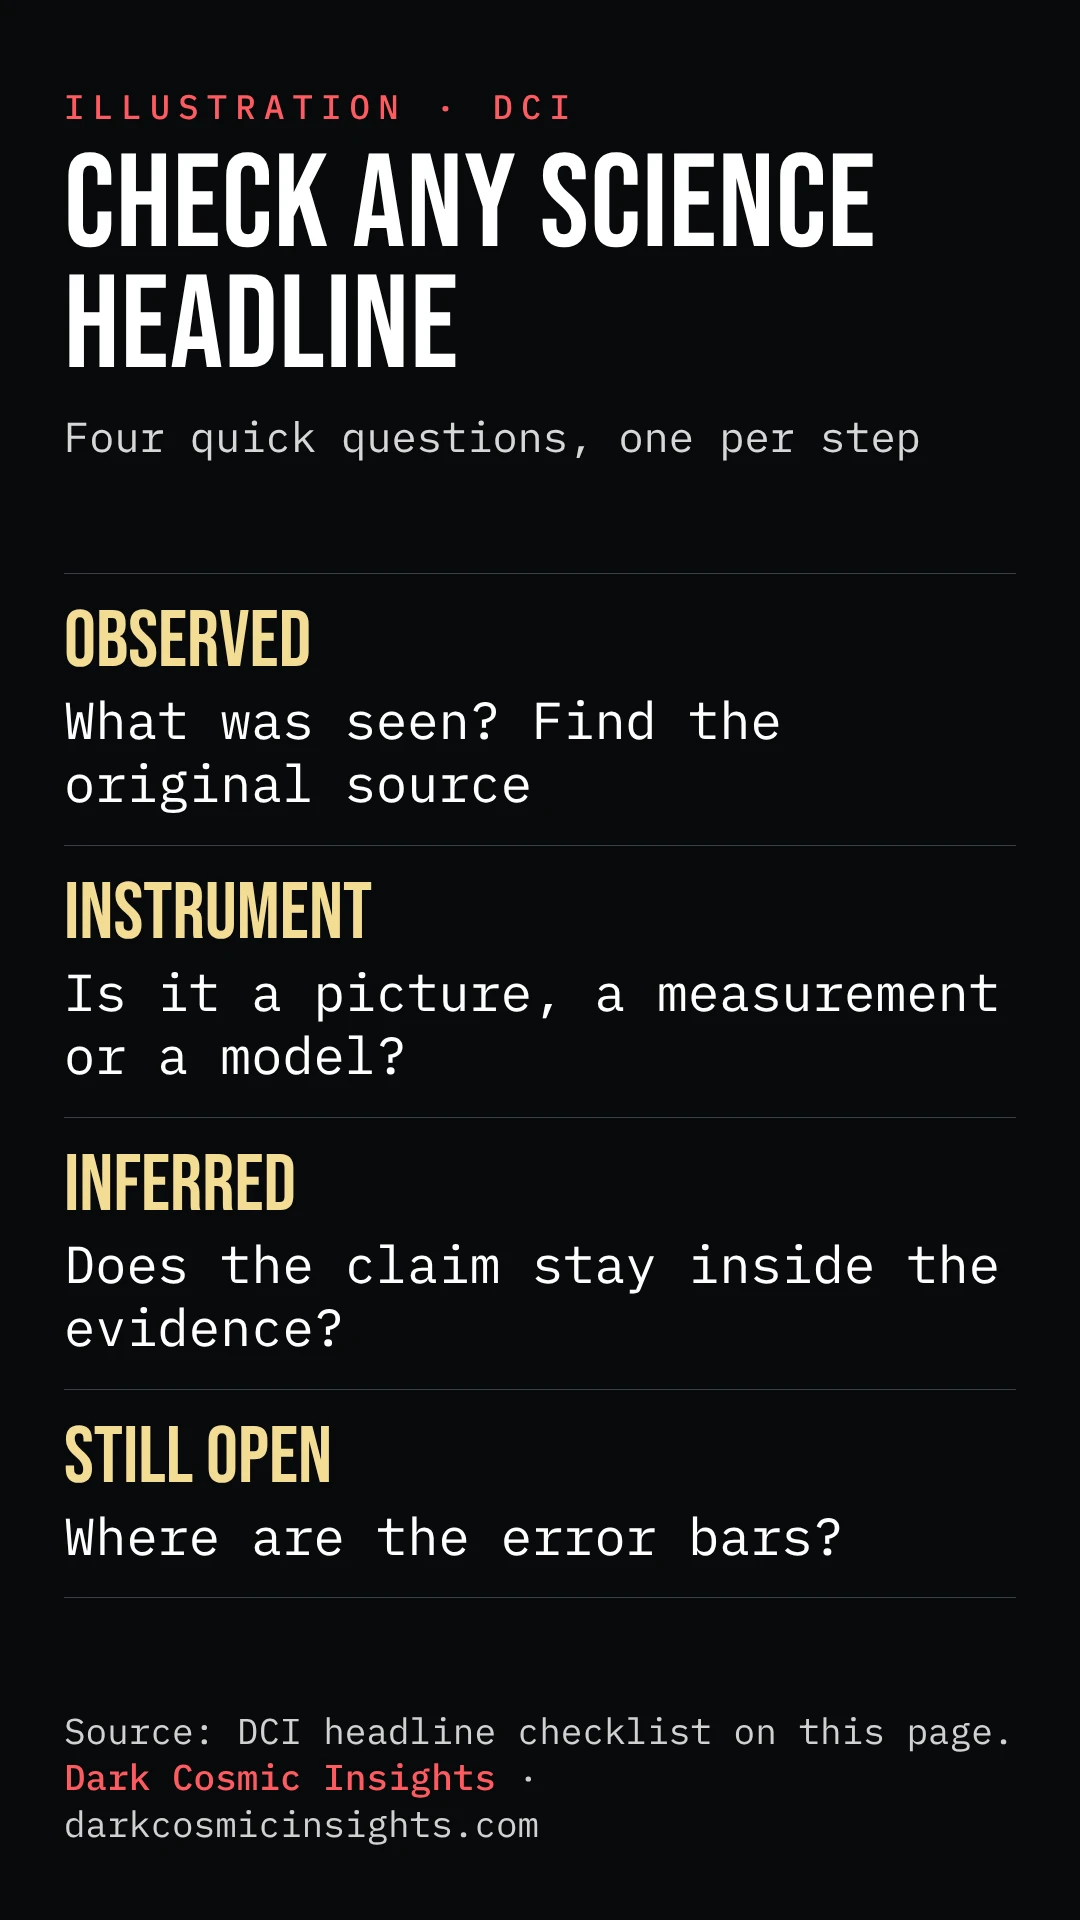
Questions to Ask About Any Science Headline
You don’t need a lab to test a claim. Here are seven checks you can run in a few minutes.
- What was actually seen? (Observed) Strip the headline back to the raw fact. “Faults on the Moon” is an observation. “The Moon is falling apart” is not.
- Can you find the original source? (Observed) Look for the observatory, journal or institution that first released it. A repost can lose the caption, the credit and the date.
- What did the seeing, and what can it miss? (Instrument) An infrared camera sees through dust that blocks visible light. A seismometer can only report the quakes that happen while it is listening. Every instrument has a blind spot.
- Is this a picture, a measurement or a model? (Instrument) Check the label. A simulation or an artist’s concept can be useful, but it is not a photo of the thing.
- Does the conclusion stay inside the evidence? (Inferred) A study that tracks carbon in two lakes is not proof that a whole region is collapsing. Watch for the jump from “found” to “means everything.”
- Where are the error bars? (Still open) Look for ranges, margins and words like “estimated,” “modeled” or “if the rate was steady.” A result with no stated limits deserves more caution, not less.
- What would change the answer? (Still open) Moon counts change when surveys see fainter objects. Dates change when models improve. If nothing could ever change the claim, it is probably not a science claim.
How This Page Was Built
Every fact on this page is summarized from a published Dark Cosmic Insights article, with no new claims added. Image and object credits link to the official NASA, ESA/Webb and Met pages. Each full story carries its own sources, Evidence Map and editorial check. Numbers are quoted as those articles state them. When an article is updated, its card here is updated to match.
About the Author
Author: King | Founder of Dark Cosmic Insights
King is the founder of Dark Cosmic Insights, a science storytelling platform exploring the strangest true stories hiding in space, science and AI. He digs into NASA, ESA and peer-reviewed research, separates what has been measured from what is still a mystery, and turns it into articles, data graphics and Shorts.
Follow the anomaly. Trace the source.