In 2014, Hubble caught four images of one exploding star. Then astronomers pointed to another patch of sky and said its light should arrive there next. In December 2015, it did.
SN Refsdal is one of astronomy’s most extraordinary replays: a single supernova whose light took several routes through a galaxy cluster. This guide follows the real images, the prediction, the dark-matter map and the expansion-rate measurements, with the latest forecast changes clearly separated from the historical story.
Observed: the 2014 cross and 2015 return. Modeled: the mass distribution, unseen earlier arrival and future replay windows. Open: how precisely lensed supernovae can resolve the expansion-rate disagreement.
In this guide
- Why did SN Refsdal appear more than once?
- The DCI SN Refsdal evidence map
- What exactly did Hubble see in SN Refsdal?
- How can gravity turn one star into an Einstein cross?
- Why does the same explosion arrive at different times?
- How did astronomers predict where the supernova would return?
- Why did the supernova’s own galaxy help solve the mass map?
- What happened on December 11, 2015?
- How can a replaying supernova measure the universe’s expansion?
- What does Supernova H0pe add to the story?
- Is SN Refsdal time travel, an echo or several explosions?
- How can you inspect the real Refsdal images yourself?
- When could Requiem and Encore appear again?
- Could we use the Sun as a gravitational lens?
- SN Refsdal by the numbers
- Watch the full DCI video
- Frequently asked questions about SN Refsdal
- Sources and further reading
- Keep exploring with Dark Cosmic Insights
- How this explainer was checked
- About The Author
What this article can and cannot establish: The telescope observations demonstrate multiple delayed images of one explosion. Mass maps and expansion-rate estimates require models, and future reappearance dates can change. This explainer follows published sources and does not treat an illustration, forecast or proposed mission as an observation.
Why did SN Refsdal appear more than once?
SN Refsdal appeared multiple times because gravity sent light from one supernova along different routes to Earth. A foreground galaxy cluster bent and magnified the light, creating several images with different arrival times. Hubble discovered four images in 2014. Astronomers modeled the cluster and predicted another image, which Hubble detected on December 11, 2015. The star did not explode again. We received another delayed view of the same event, a natural experiment that also helps measure cosmic expansion.
The DCI SN Refsdal evidence map
| Question | What we know | Status | Key source |
|---|---|---|---|
| Did the star explode more than once? | One explosion produced multiple lensed images. | Observed / explained | Read source |
| Were four images seen in 2014? | Hubble identified the Einstein cross. | Observed | Read source |
| Was another image predicted before detection? | Yes; Hubble detected SX on December 11, 2015. | Observed | Read source |
| Did observers record a 1998 image? | No; the earlier arrival was inferred from models. | Modeled, unobserved | Read source |
| Can the host galaxy constrain dark matter? | Repeated knots constrain the lens mass map; dark matter is inferred. | Modeled | Read source |
| How long was the SX–S1 delay? | 376.0 +5.6/−5.5 days in the 2023 analysis. | Measured | Read source |
| Did Refsdal settle the Hubble tension? | No; lens-model uncertainty remains important. | Open | Read source |
| Is Requiem still fixed for 2037? | No; newer models place its next image around 2026–27. | Modeled | Read source |
Status key: Observed = seen in telescope data. Measured = quantified from observations. Modeled = inferred under stated assumptions. Open = not settled by the evidence.
Cite this framework: Dark Cosmic Insights, “SN Refsdal Evidence Map,” 2026. The table is an editorial guide to the linked research, not a new scientific analysis.
What exactly did Hubble see in SN Refsdal?
Imagine finding four bright points where you expected only a distant galaxy. Each point brightens and fades like a supernova. They surround a nearer galaxy in a cross. The tempting explanation is four explosions happening together. The evidence points to something stranger: four views of one explosion.
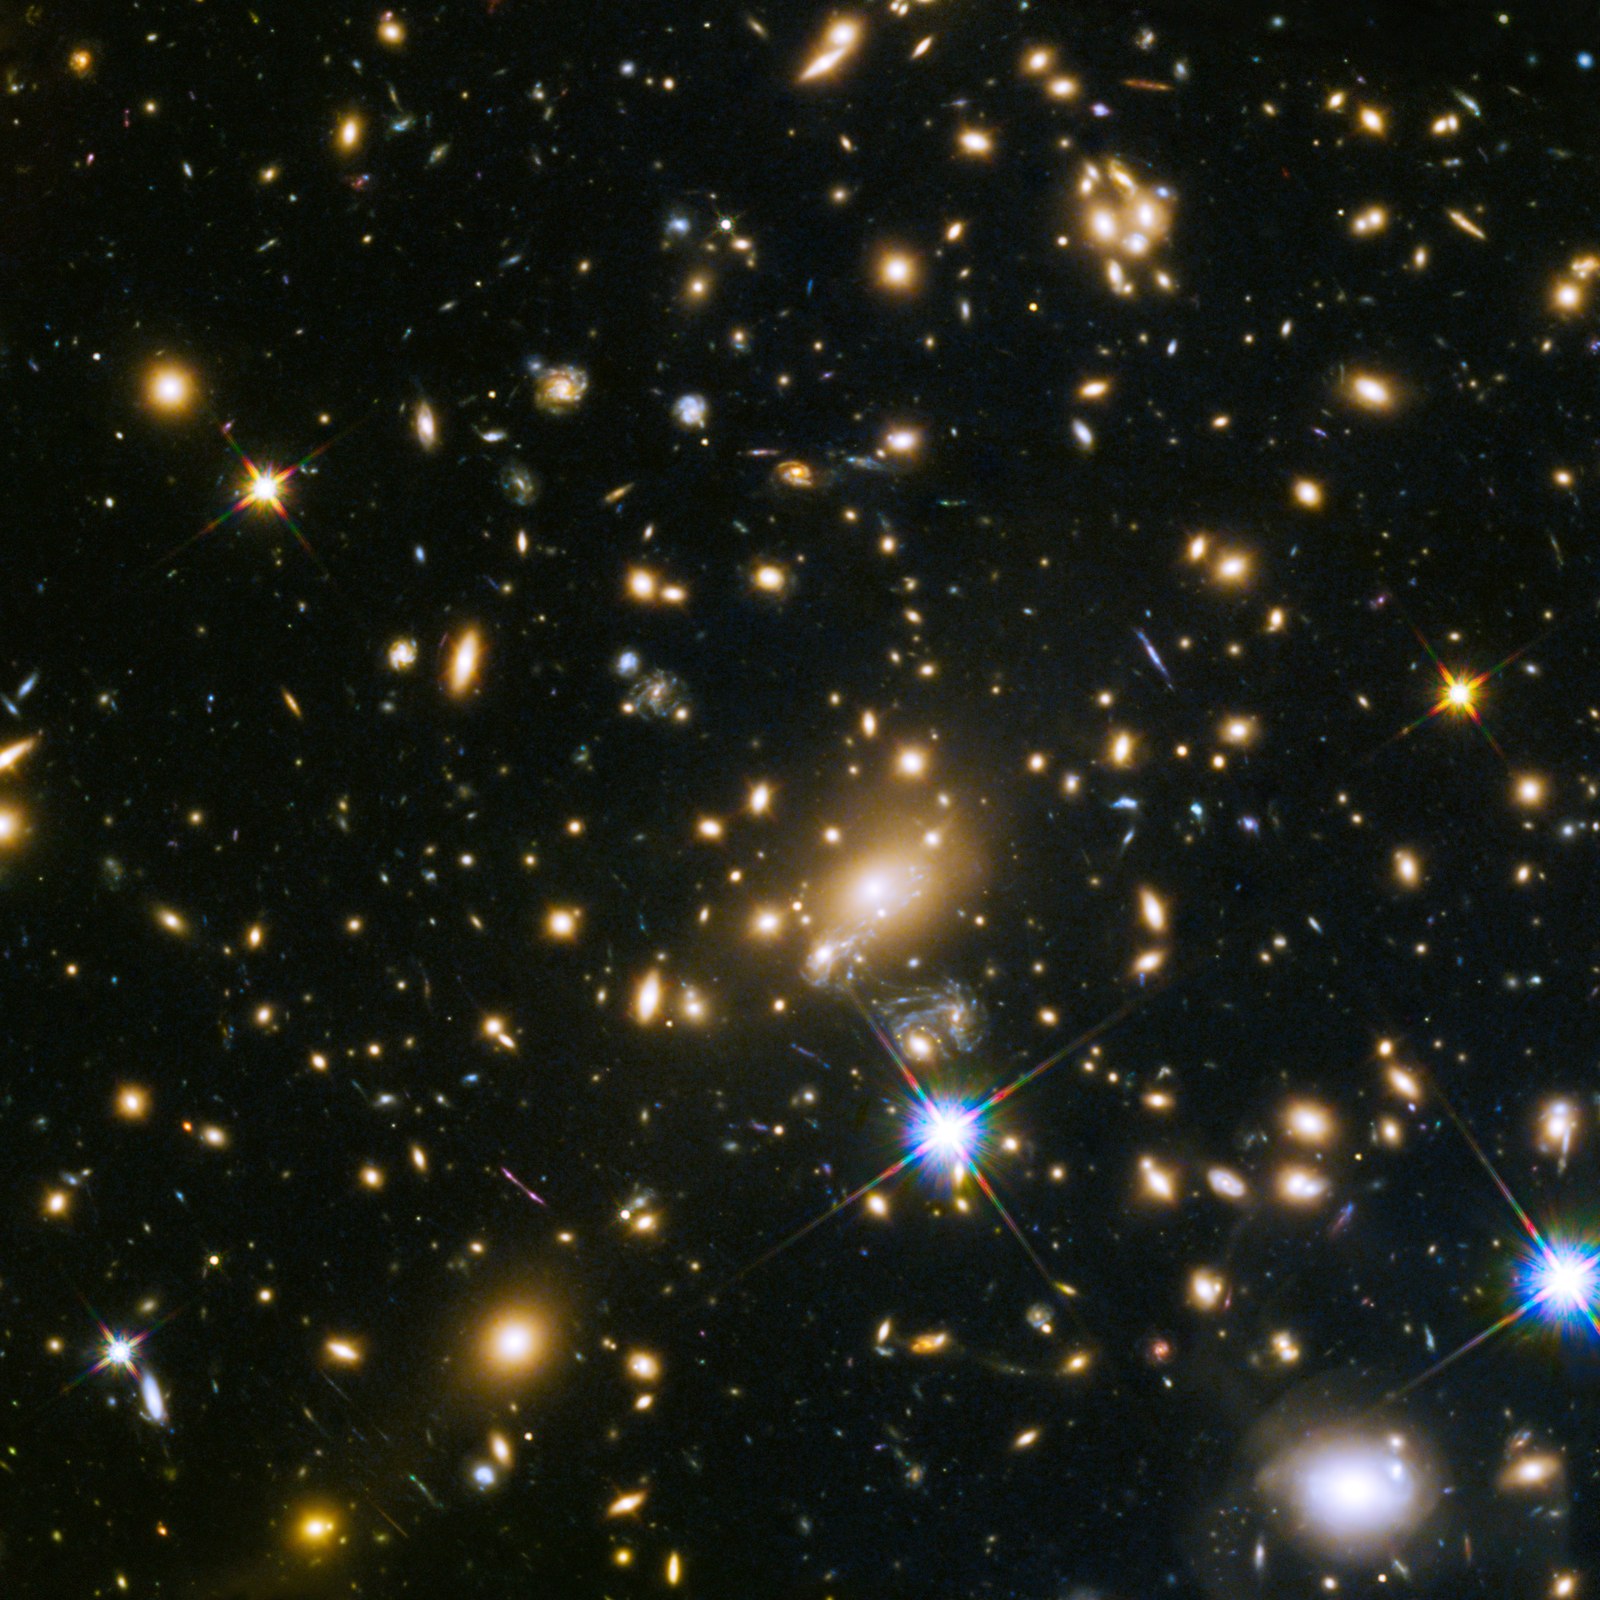
That was the puzzle astronomers encountered in Hubble observations of the galaxy cluster MACS J1149.6+2223 in November 2014. The supernova lay in a spiral galaxy far behind the cluster. The cluster’s gravity had already distorted that spiral into several visible images. One intervening member galaxy split the light from the supernova into four images arranged around it, a pattern called an Einstein cross. ESA/Hubble’s discovery account describes the layered lens that made this possible.
The distinction between an object and its image matters throughout this story. Astronomers were not looking at four physically separate copies of a star. They were looking in four directions from which light from the same star reached the telescope. The intervening mass changes the mapping between positions in the background universe and positions on our sky.
The supernova was named after Norwegian astrophysicist Sjur Refsdal. In 1964, he proposed using the time delays between gravitationally lensed supernova images to measure the expansion of the universe. Decades later, a supernova bearing his name supplied the sort of experiment he had described. The name honors the idea behind the measurement, not a claim that he predicted this particular star.

How can gravity turn one star into an Einstein cross?
In general relativity, mass changes the geometry of spacetime. Light follows that geometry. If a massive object lies between us and a more distant source, light that would otherwise miss us can be redirected toward us. The effect is called gravitational lensing.
A glass lens bends light as it passes through material. A gravitational lens does not need a transparent surface or a piece of glass. Galaxies, clusters and their surrounding dark matter reshape the routes available to the light. Depending on the alignment and mass distribution, the result can be a magnified source, an arc, several separate images or an almost complete ring.
Refsdal involved lensing on two scales. The galaxy cluster made multiple images of the background spiral. A galaxy within the cluster then split one view of the supernova into the four-point cross. Keeping those two scales separate makes the later prediction much easier to understand: a new image could appear elsewhere in another lensed view of the host galaxy, rather than as a fifth point squeezed into the original cross.
The familiar ring-and-cross graphics are helpful, but the real geometry is more complicated than a neat classroom diagram. An extended galaxy is not a point source. Mass is not distributed in perfectly round piles. Alignment, source size and the lens’s shape all affect what appears. As the Hubble discovery release explains, the cluster and its member galaxy work together; there is no universal rule that every uneven lens must produce exactly four images.
Lensing also magnifies the source. That can make a normally inaccessible explosion measurable. But magnification does not remove the need to understand the lens. It gives scientists a brighter signal while adding an intervening mass distribution they must reconstruct.

Why does the same explosion arrive at different times?
Light travels at the same local speed in vacuum, but the routes in a gravitational lens are not equivalent. Some routes have different geometric lengths. They also pass through different gravitational environments. Both geometry and gravitational delay contribute to the time difference measured at Earth.
Think of a single flash that can reach a camera by several routes. The camera does not need the source to flash again to record a later arrival. That analogy captures the replay, although real spacetime is not a road network and the gravitational part of the delay cannot be reduced to extra kilometres alone.
In the original Refsdal cross, the four images followed sufficiently similar routes that astronomers could observe their changing brightness over overlapping periods. A different cluster-scale image followed a route with a much larger delay. The brightening and fading would arrive there later, giving astronomers time to calculate where to look and to wait for the signal.
The 2015 ESA/Hubble account also describes an earlier image inferred to have arrived around 1998. Nobody recorded that appearance. Its date came from lens models, not from a photograph of the supernova in 1998. That is why our timeline labels it modeled, unobserved rather than placing it on the same footing as the 2014 and 2015 detections.
The word “replay” is a useful description of what the observer experiences. The universe did not rewind, and the star did not recover and explode again. A different bundle of photons from the same event completed its journey to us. The information traveled normally along its own path; our opportunities to receive it were separated in time.

How did astronomers predict where the supernova would return?
The crucial ingredient was a mass map of the foreground cluster. Such a map estimates where the matter that bends the light is located and how strongly it affects the observed background galaxies. Stars and hot gas contribute, but dark matter supplies much of the gravitating mass.
Researchers started with things telescopes could measure: the positions and shapes of lensed images, the distances indicated by their redshifts, and information about galaxies inside the cluster. They built models that could reproduce those observations. A model that puts a background image in the wrong place is missing something about the lens, the source identification or the assumptions used to connect them.
Once a model reproduced the observed system, astronomers could calculate other images of the same source and the delays between them. Several teams did this independently. Their predictions were not identical. Different approaches to distributing mass, choosing constraints and representing uncertainty produced different arrival windows and brightness expectations.
That disagreement was useful. A prediction made before the new image appeared could be tested against something the modelers had not yet seen. The event therefore checked the models rather than merely demonstrating that a complicated fit could describe an existing picture. ESA/Hubble’s reappearance announcement explicitly connects the successful forecast to the distribution of matter, including dark matter, in the cluster.
It is important to describe the forecast precisely. Astronomers predicted the appearance of another image of a known supernova. They did not predict the exact time when a distant, previously unobserved star would begin its explosion. The event had already been seen through other routes, giving them an unusually informative starting point.
Why did the supernova’s own galaxy help solve the mass map?
A single bright point gives a model one position to explain. A spiral galaxy contains many recognizable features: curved arms, bright star-forming regions and compact knots of light. When lensing makes several distorted images of the same galaxy, those features become a set of matching clues.
The images may be stretched, magnified or reversed in orientation. Astronomers nevertheless identify corresponding regions across them. The question is concrete: if this bright knot in one image and that knot in another come from the same physical region, can one lens model place both of them where the telescope sees them?
Repeating that exercise gives the model many constraints at once. In Grillo and colleagues’ 2016 reconstruction, the analysis used 88 reliable multiple images associated with ten background sources and identified 18 distinct knots in Refsdal’s host galaxy. Those are the inputs of that particular study, not a universal list used by every team. Their value is the additional detail with which the model can be tested.
This is not a direct photograph of dark matter. It is an inference from how gravity has rearranged visible background light. The model must account for the observed positions while also representing the cluster’s galaxies and more extended mass. A successful reconstruction can constrain invisible matter because invisible matter still gravitates.
Nor does matching all the knots guarantee a unique answer. Different mass distributions can sometimes fit image positions similarly well while predicting different delays or magnifications. Additional measurements and independent modeling help reveal those weaknesses. Refsdal’s host galaxy made the map more informative, but the later supernova arrival supplied a further test that image positions alone could not provide.

What happened on December 11, 2015?
Hubble detected the predicted new image of SN Refsdal on December 11, 2015. The published comparison shows the relevant area in October and December. The later frame contains the new point of light at the anticipated location. That is the observational payoff: a patch of sky selected using a model acquired the signal astronomers had been waiting for.
The new image is commonly labeled SX; the four original cross images are labeled S1 through S4. Those labels identify lensed images, not separate stars. They let researchers compare measured brightness curves and time delays without implying that the source itself has multiplied.
Discovery time is not the same as peak-brightness time. A supernova brightens and fades over an extended period, and a telescope samples that changing signal at particular observing times. To measure a precise delay, astronomers compare the shapes of the light curves, not simply the calendar dates when someone first noticed each image.
That distinction matters when you see “about a year later” beside a more precise delay. The first is a useful summary of the story. The second comes from a quantitative comparison of the time-dependent signals. Kelly and colleagues’ 2023 analysis measured an SX–S1 delay of 376.0 days, with an uncertainty of +5.6/−5.5 days.
The return was a striking success for gravitational lensing predictions. It was not proof that every detail of every cluster model was right. The observed position, timing and magnification allow different parts of those models to be tested, and the remaining differences are scientifically useful.

How can a replaying supernova measure the universe’s expansion?
The Hubble constant, written H₀, describes the present-day expansion rate of the universe. Its usual unit is kilometres per second per megaparsec, or km/s/Mpc. A megaparsec is about 3.26 million light-years. The unit relates expansion speed to distance; it is not the speed at which the supernova exploded.
Lensed-supernova delays carry information about cosmic distances. If researchers know the source and lens redshifts, measure a time delay and model the gravitational lens, they can infer a combination of distances that depends on the expansion rate. Refsdal therefore supplies a route to H₀ different from building a ladder of distances using nearby stars.
The best-known disagreement, the Hubble tension, is between values inferred from early-universe measurements under a cosmological model and higher values obtained from some late-universe distance-ladder measurements. For orientation, these are often summarized as about 67 and 73 km/s/Mpc. The disagreement motivates independent methods, but those shorthand numbers do not include every measurement or every uncertainty.
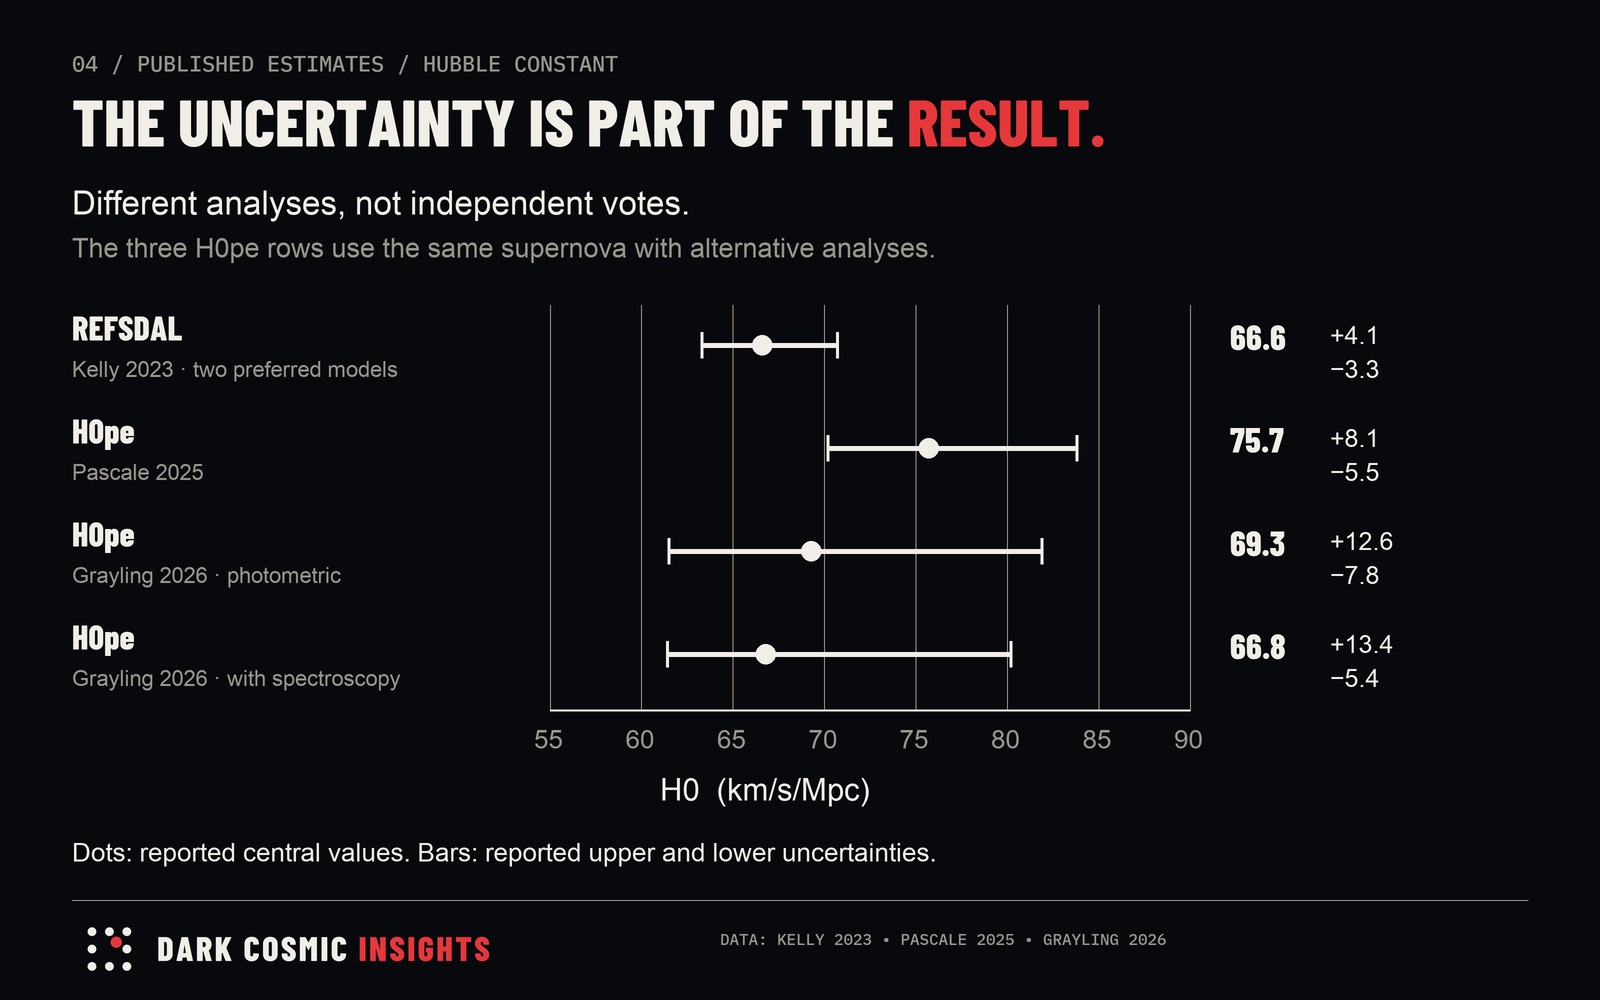
The 2023 Refsdal study in Science reported 64.8 +4.4/−4.3 km/s/Mpc when combining eight pre-reappearance lens models. Using the two models the authors considered preferred gave 66.6 +4.1/−3.3 km/s/Mpc. Both should be attributed to that analysis and its modeling choices. Presenting only “Refsdal measured 67” hides information readers need to judge the result.
The delay itself was measured to about 1.5% precision, but the Hubble constant was not. The mass model contributed much of the remaining uncertainty. That is the central limitation of the method and the reason the host-galaxy knots matter beyond making an impressive visual.
Refsdal’s result favored the lower answer, while its uncertainties still allowed the higher one. It did not settle the Hubble tension. Its lasting contribution is an independent measurement with a different collection of assumptions and errors, one that can become more powerful as the sample and lens models improve.
What does Supernova H0pe add to the story?
Webb observations provided another remarkable case: three images of a lensed Type Ia supernova nicknamed Supernova H0pe. Type Ia supernovae are useful because their luminosities can be standardized using their observed behavior. That supplies information about lens magnification as well as timing.
Pascale and colleagues’ published 2025 analysis reported a best estimate of 75.7 +8.1/−5.5 km/s/Mpc. NASA’s preliminary 2024 account gave 75.4; the published value is used here. It is tempting to turn the comparison into two cosmic votes: Refsdal for 67, H0pe for 73. That framing makes the evidence sound more decisive than it is. The uncertainty intervals are substantial, and the measurements depend on how both the supernova and lens are modeled.
A later BayeSN-TD reanalysis illustrates the issue. It reported 69.3 +12.6/−7.8 km/s/Mpc, or 66.8 +13.4/−5.4 when incorporating spectroscopic constraints, and concluded that the precision was insufficient for a meaningful determination of the Hubble tension. These are alternative analyses, not a reason to silently overwrite the original result.
The useful lesson is methodological. Standardizable brightness can help break some lensing ambiguities, but it brings calibration and supernova-model assumptions. Better spectra, repeated observations and better lens reconstructions all matter. A future collection of well-observed events will be more informative than treating one point estimate as the final answer.
For this reason, DCI keeps the dates and uncertainty ranges attached to the numbers. The exciting development is that astronomers can turn delayed stellar explosions into cosmological tools. The responsible conclusion is that those tools are still being refined.
Is SN Refsdal time travel, an echo or several explosions?
It is one explosion seen through multiple gravitationally lensed images. Nothing in the observation requires a star to explode twice or for information to travel backward in time. We see old light whenever we look into space; a lens adds multiple routes with different delays.
Calling it an “echo” can be intuitive, but it can also confuse two different phenomena. A light echo often refers to light scattered by surrounding dust, with different path lengths causing illuminated structures to appear later. Refsdal’s replay is caused by gravitational lensing through foreground mass. Both can produce delayed views, but their physical mechanisms are different.
It is also not four stars lined up by chance. The lens geometry, association with multiple images of the same host galaxy, and corresponding supernova behavior support the identification of one source. The successful prediction of another image adds a particularly compelling test.
Finally, the cross is not a drawing of where the photons traveled in three-dimensional space. A telescope image gives their apparent arrival directions on the sky. Our light-path diagram is therefore labeled illustration, not to scale. Its curves explain the concept; they are not a measured reconstruction of the exact paths.
The real story is already unusual enough without supernatural machinery. Gravity lets us receive the same event at different times and then use the differences to investigate matter we cannot see and distances we cannot measure with a tape.
How can you inspect the real Refsdal images yourself?
Start with the original Hubble Einstein-cross image. Identify the central foreground galaxy, then the four point-like images around it. The arrows and labels are annotations added to help readers locate faint features. The telescope measured light; the explanatory marks are not structures in space.
Next open the October–December 2015 comparison. Keep the field orientation and framing fixed while comparing the two panels. Find the position where the later image appears. That simple before-and-after exercise is more revealing than a dramatic crop that removes the surrounding reference points.
Then look at the annotated cluster and host-galaxy map. Notice how different appearances of one source can occupy separated parts of the field. Read its historical labels carefully: a predicted position or inferred 1998 appearance is not equivalent to an observed detection.
You do not need an observatory to examine those public images, but you do need one to collect comparable data. This is not a target where a backyard telescope will reveal the four supernova images today. The discovery involved a faint, distant and changing source magnified by an extraordinary alignment.
For a useful second step, read DCI’s guide to real space images and color processing and its explainer on why Hubble and Webb see the same object differently. The questions are the same here: what did the instrument measure, how was it displayed, and which annotations explain rather than constitute the data?
When could Requiem and Encore appear again?
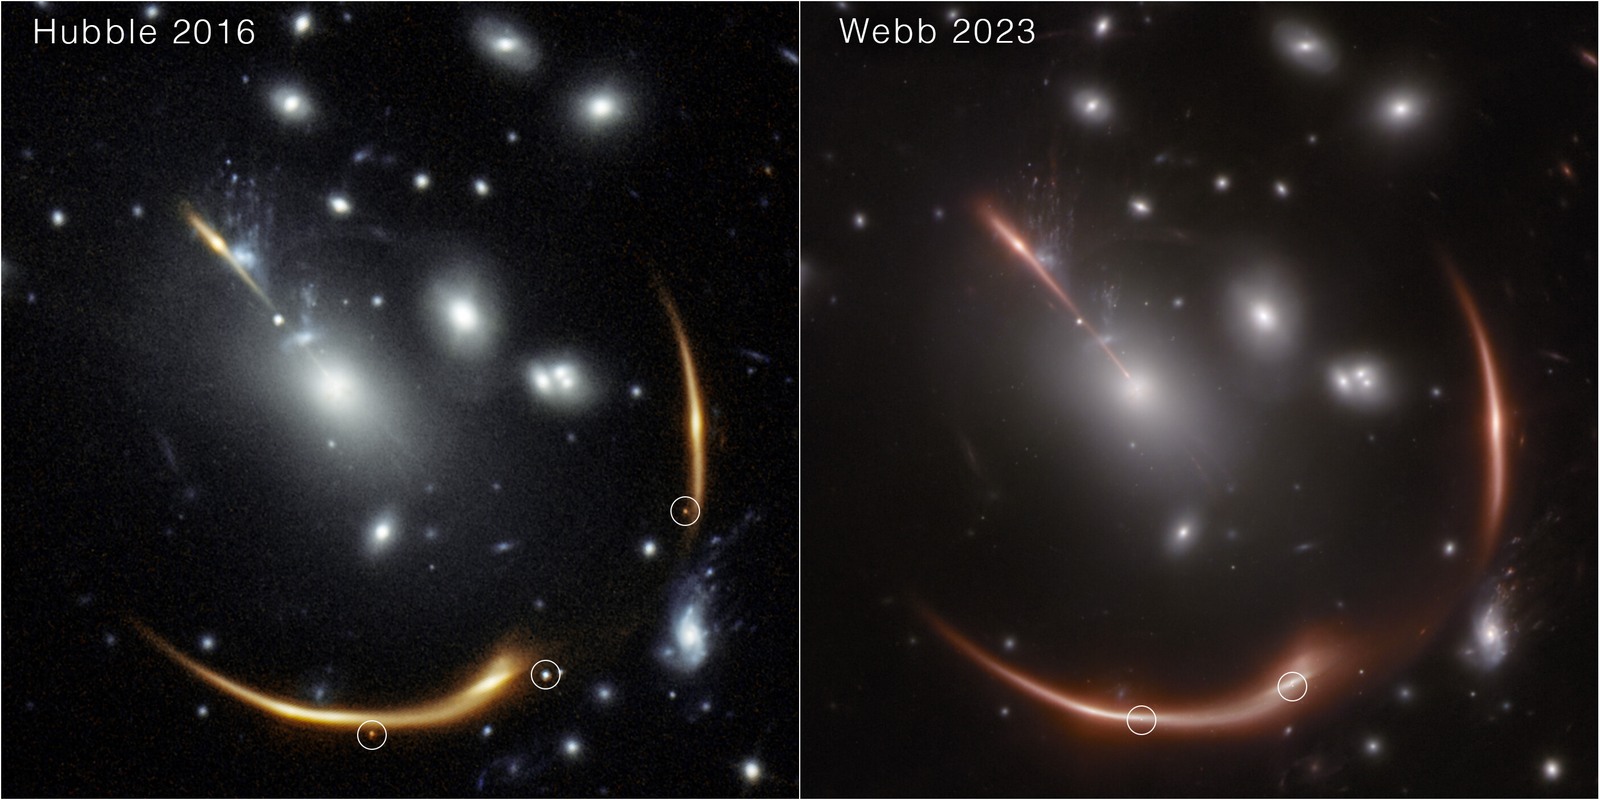
Refsdal is not the only supernova system with delayed light still of interest. Another background galaxy, lensed by MACS J0138.0−2155, hosted two distinct explosions: Supernova Requiem, seen in Hubble observations from 2016, and Supernova Encore, seen by Webb in 2023. They are two supernovae in the same host galaxy, not two names for Refsdal or for a single explosion.
This part of the story requires a date check. Widely shared early reports put Requiem’s return around 2037, and subsequent coverage discussed reappearances in the mid-2030s. Those forecasts came from the mass maps available at the time. They should not be repeated as a fixed current schedule.
A peer-reviewed April 2026 analysis in Astronomy & Astrophysics brought Requiem’s expected next appearance forward substantially. Its four best-fitting models predict roughly April–December 2026 for an assumed H₀ of 73, versus March–November 2027 for an assumed H₀ of 67, including their reported one-sigma uncertainties. The same work places Encore’s next appearance no earlier than mid-2031.
Those are conditional predictions, not appointment times. The exact forecast depends on both the lens reconstruction and the assumed expansion rate. Improving the model can move the window, which is a vivid demonstration of why lensing science cannot be reduced to drawing a long and a short line around a galaxy.
As of this article’s November 7, 2026 source check, the material reviewed here does not establish a new detection of Requiem’s returning image. The article therefore reports the published forecasts, not a confirmed return. An observing proposal or scheduled observation is not itself a discovery announcement.
What comes next is continued monitoring, better mass constraints and more lensed supernovae. Each well-observed system adds a chance to test models before the delayed light arrives, rather than explaining the result only after the fact.
Could we use the Sun as a gravitational lens?
The same general-relativistic principle also applies to our own Sun. In a proposed solar gravitational lens mission, a spacecraft far beyond the planets could use sunlight-adjacent paths to collect greatly magnified light from a distant target, potentially an exoplanet.
The Sun’s useful focal region begins at roughly 550 astronomical units, where one astronomical unit is the average Earth–Sun distance. That is about 82 billion kilometres, or 51 billion miles. Unlike the focal point of an idealized classroom lens, the solar gravitational lens has a focal region extending outward along the target’s line of sight.
NASA’s concept study explores how observations and image reconstruction might work. A spacecraft would not simply take an ordinary sharp snapshot of another Earth. The concept involves precise alignment, scanning and reconstructing the target from the received signal while contending with the solar corona and demanding travel requirements.
This is a mission concept, not an operating telescope or an approved launch promise. It belongs beside the Refsdal story because both use gravity as part of an optical system. The applications, observing geometry and engineering are very different.
Refsdal demonstrates a capability nature already provides in the distant universe. The solar-lens concept asks whether we could deliberately position a spacecraft to exploit a related effect nearby, on a scale still far beyond routine exploration. The connection is inspiring precisely because we can separate demonstrated physics from the mission that would be needed to use it.
SN Refsdal by the numbers
1 explosion. Multiple images do not mean multiple supernovae.
4 original images. The Einstein cross was discovered in November 2014.
December 11, 2015. Hubble detected the predicted SX image.
About 1998. Model-inferred earlier appearance, not observed.
376.0 +5.6/−5.5 days. SX–S1 delay measured in the 2023 analysis.
66.6 +4.1/−3.3 km/s/Mpc. Refsdal H₀ estimate using two preferred lens models in Kelly et al. (2023).
18 host-galaxy knots. Distinct matching regions used in Grillo et al.’s 2016 model.
About 9 billion years. Approximate travel time of the supernova light, not its present-day distance.
1964. Sjur Refsdal proposed using lensed-supernova time delays to measure cosmic expansion.
About 550 AU. Beginning of the solar gravitational lens focal region: roughly 82 billion km (51 billion miles), for a proposed mission concept.
Watch the full DCI video
Frequently asked questions about SN Refsdal
Did SN Refsdal explode twice?
No. SN Refsdal exploded once. Gravity bent its light into several routes, so images of the same explosion reached Earth at different times.
What is an Einstein cross?
An Einstein cross is a pattern of four gravitationally lensed images around a foreground lens. In Refsdal’s case, a galaxy within the foreground cluster split one view of the supernova into four images.
When did SN Refsdal reappear?
Hubble detected the predicted image, called SX, on December 11, 2015. That is the detection date, not necessarily the date of peak brightness.
Was SN Refsdal seen in 1998?
No observation of the inferred 1998 appearance was recorded. That earlier arrival was reconstructed with lens models and must be distinguished from the observed 2014 and 2015 images.
How does gravitational lensing measure the Hubble constant?
Researchers combine measured time delays, source and lens redshifts, and a model of the foreground mass. Together these constrain cosmic distances and the expansion rate, with uncertainty from the lens model as well as the observations.
Did Refsdal or Supernova H0pe solve the Hubble tension?
No. The reported results have substantial uncertainties and depend on modeling choices. Later analyses of H0pe reinforce the need to compare complete uncertainty ranges rather than treating a single best-fit value as decisive.
Will Supernova Requiem return in 2037?
2037 was an early published forecast, not a guaranteed date. April 2026 modeling moved the expected next appearance to roughly 2026–2027, depending on the lens model and assumed expansion rate.
Can I see SN Refsdal with a backyard telescope?
The individual supernova images were faint, distant and time-dependent, requiring professional observations. You can examine the real Hubble images and their source information freely through the linked ESA/Hubble pages.
Sources and further reading
Kelly et al. (2023). Public full-text copy of the Science study, NSF Public Access Repository.
Keep exploring with Dark Cosmic Insights
Learn how astronomers measure stars they can never visit, decode what makes a space image real, and compare Hubble and Webb views of the same nebula. For another example of turning a changing signal into a physical measurement, explore how radiocarbon reveals old carbon in peatlands.
How this explainer was checked
This article was checked against ESA/Hubble discovery and image pages, the 2023 Refsdal cosmography paper, H0pe research and a peer-reviewed April 2026 update to Requiem/Encore forecasts. Measurement dates, model choices and uncertainty ranges are kept with the claims they qualify. Historical source headlines are not treated as stronger evidence than the research underneath them.
Hubble and Webb panels are labeled observations and retain their source credits. Original DCI diagrams are labeled illustrations and are not telescope images or scale reconstructions. Source check: November 7, 2026.
About The Author
Author: King | Founder of Dark Cosmic Insights
King is the founder of Dark Cosmic Insights, a science storytelling platform exploring the strangest true stories hiding in space, science and AI. Through Dark Cosmic Insights, King digs into NASA, ESA and peer-reviewed research, separates what has been measured from what is still a mystery, and turns real discoveries into clear articles, original data graphics and Shorts that help curious people see the universe more clearly.
Follow the anomaly. Trace the source. 🔭
November 7, 2026