Picture a river with a fixed ripple on its surface. The water rushes downstream, yet the ripple stays put. Something like that is now happening around Saturn’s south pole. The winds of a jet stream there peak at about 116 meters per second (about 260 mph), and riding on that jet is a ten-sided wave, a decagon. The wind races through the pattern, while the pattern itself barely moves: measured against Saturn’s standard rotation frame, the decagon drifts east at just 2.5 meters per second (about 6 mph) (Sánchez-Lavega et al. 2026).
NASA announced the find on September 2, 2026, the day the study was published in Science Advances. The team traced the shape in Hubble Space Telescope images back to October 2023, and NASA says it “appears to be strengthening” (NASA Science, September 2, 2026). NASA calls it the first large, regular-sided jet pattern observed in Saturn’s southern hemisphere. Saturn already had one famous polygon, the hexagon at its north pole. Now it seems to be growing a second one in the south.
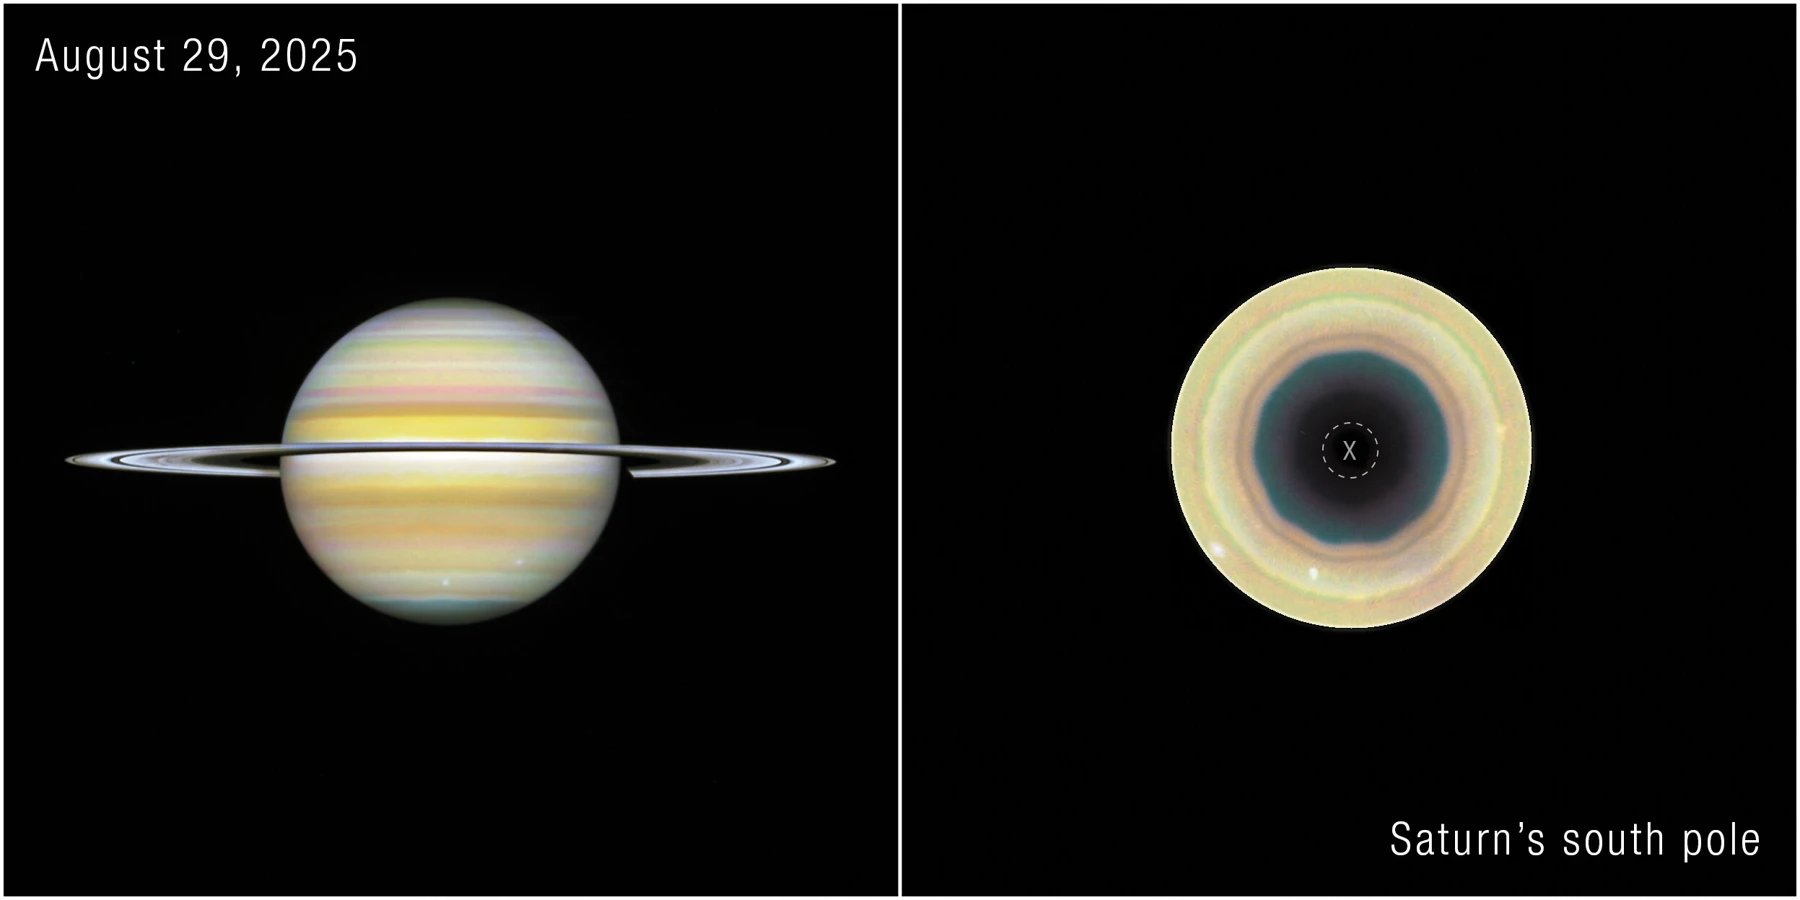
Observed, measured, modelled, open. The decagon’s shape is observed in Hubble and ground-based images. Its size, latitude, drift and wobble are measured. The idea that it is a Rossby wave trapped by the jet is modelled. Why it formed now, what role a nearby red storm plays, and whether it will last are still open.
Quick Answer: What Is Saturn’s Decagon?
Saturn’s decagon is a ten-sided wave pattern in a jet stream near Saturn’s south pole, centered at about 63°S in red-light images (Sánchez-Lavega et al. 2026). It is a wave, not a storm: the cloud bands bend into ten sides and ten corners as they circle the pole. Hubble’s Outer Planet Atmospheres Legacy (OPAL) program caught faint signs of it in 2023, clearer views in 2024, and all ten corners in 2025 (NASA Science). The study’s leading idea is that it is a Rossby wave held in place by the shape of the jet, possibly born from an instability in the jet. Nobody yet knows why it appeared now, or whether it will last like the northern hexagon.
What this article can and cannot establish. It can show you what Hubble and ground-based observers actually recorded, the measured numbers behind the pattern, and which explanations come from models. It cannot tell you exactly when the decagon formed. The earliest Hubble images that show it are from October 2023, but Saturn’s south was hidden from Earth’s view for years before that. It also cannot tell you whether the decagon will still be there in a decade, because the team says it may be a transient, evolving feature.
Table of Contents
The DCI Evidence Map: Saturn’s Decagon
| Question | What we know | Status | Key source |
|---|---|---|---|
| Is there a ten-sided pattern near Saturn’s south pole? | Yes, in Hubble images from 2023, 2024 and 2025, and in ground-based images | Observed | Sánchez-Lavega et al. 2026 · NASA Science |
| Where is it centered? | About 63°S in red filters; about 60.5°S in the 889 nm methane band | Measured | Sánchez-Lavega et al. 2026 |
| How long is one wave cycle around the pole? | Mean wavelength 16,782 ± 1,100 km (average, not a side length) | Measured | Sánchez-Lavega et al. 2026 |
| How fast does the pattern move? | +2.5 ± 0.2 m/s eastward relative to Saturn’s System III frame, in June–October 2025 data | Measured | Sánchez-Lavega et al. 2026 |
| How fast is the jet it sits in? | Peak 116 m/s at 60.5°S, little changed since 1981 | Measured | Sánchez-Lavega et al. 2026 |
| Do the corners wobble? | Yes: back and forth with a mean period of 32.5 days | Measured | Sánchez-Lavega et al. 2026 |
| What is it, physically? | Likely a Rossby wave trapped by the jet’s curvature, possibly from a jet instability | Modelled | Sánchez-Lavega et al. 2026 |
| Did a nearby red anticyclone trigger it? | Its role “remains unclear”; one model run says it cannot be ruled out | Open | Sánchez-Lavega et al. 2026 |
| When did it form, and will it last? | Unknown; it “did not exist in Saturn’s previous year” and may be transient | Open | Sánchez-Lavega et al. 2026 |
| Is it a storm? | No: the team describes it as a wave in a jet stream | Not supported | NASA Science |
Status key: Observed = seen directly in images or data. Measured = a number with a stated uncertainty. Modelled = inferred from measurements through a physical model, dependent on assumptions. Open = unresolved; the evidence is incomplete or points different ways. Not supported = the evidence goes against the claim, or there is none for it.
Cite this framework: “DCI Evidence Map: Saturn’s Decagon,” Dark Cosmic Insights, November 2026, darkcosmicinsights.com/saturn-decagon/.
What Did Hubble Actually See?
Hubble photographs Saturn about once a year through OPAL, a program that has tracked the outer planets for more than a decade. Each OPAL visit covers two full Saturn rotations, so the whole globe gets mapped (Sánchez-Lavega et al. 2026). Those yearly maps are what let the team watch the decagon take shape.
Three snapshots, 2023 to 2025
- October 22, 2023. Saturn’s south was only just tilting back into view. Even so, Hubble’s red-filter images (wavelengths longer than 600 nm) showed a faint ten-sided outline near 63°S.
- August 22, 2024. With a better viewing angle, the sides and corners became easier to see. Their contrast was still patchy around the circle.
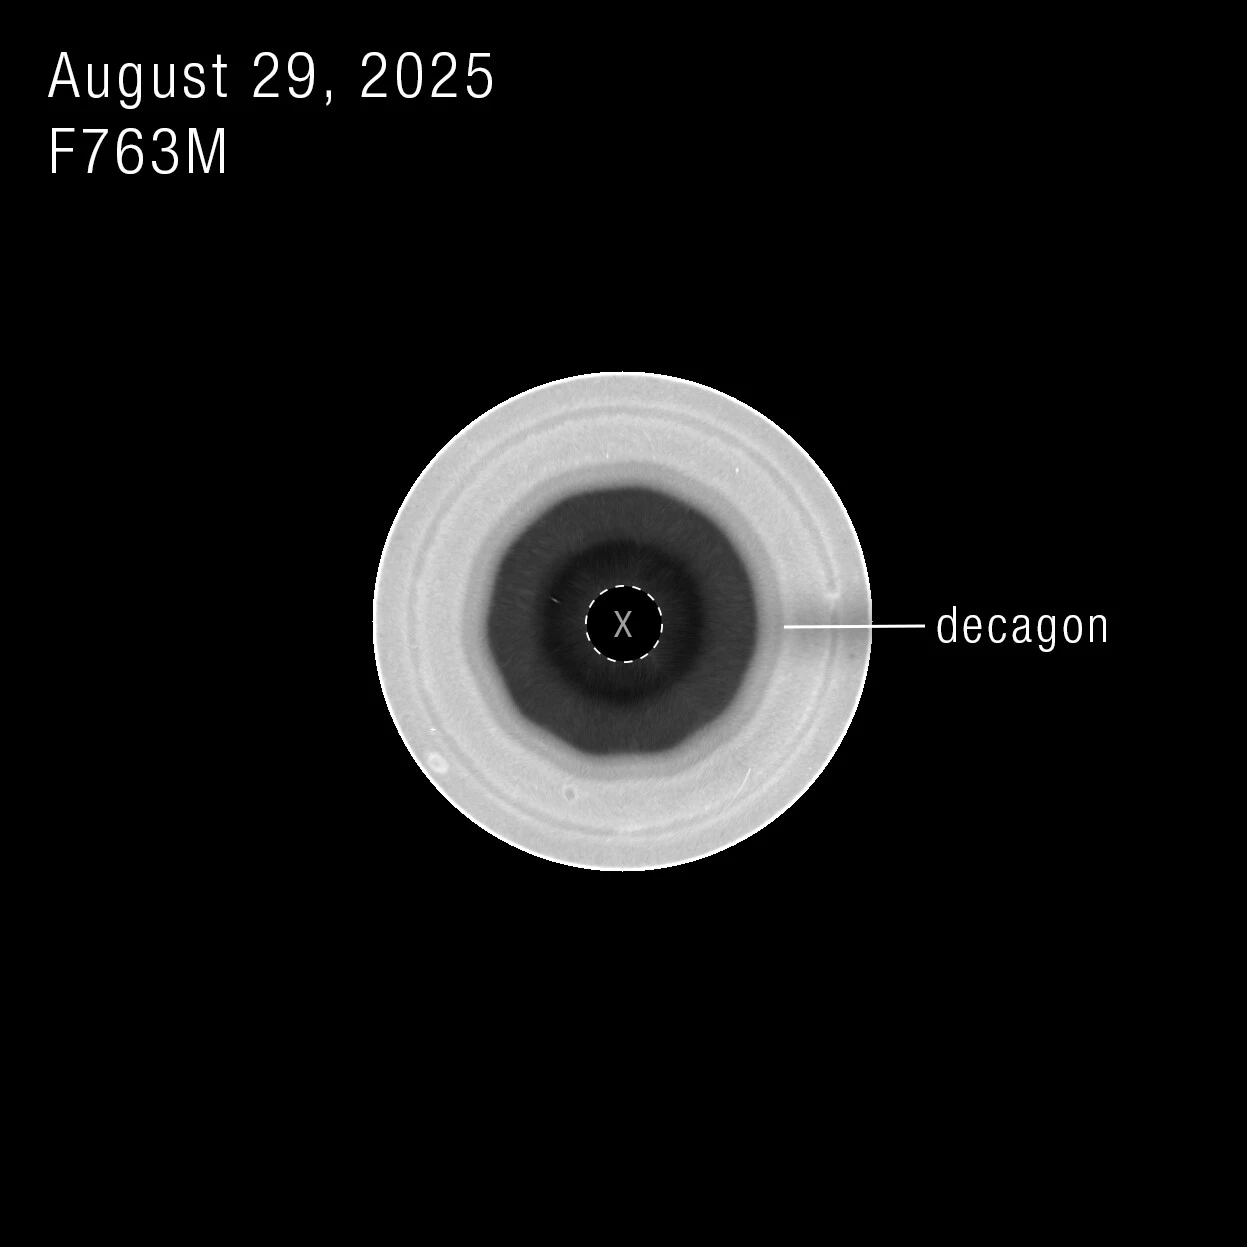
- August 29 and September 16–17, 2025. All ten corners were fully developed. Three corners and their sides were very prominent, four were less prominent, and three were less defined.
Those dates come straight from the paper’s methods section, which lists the Hubble programs used (Sánchez-Lavega et al. 2026). NASA summarizes the arc in one line: “subtle hints” in the earlier images grew into “a clearly defined pattern” (NASA Science).

Why the processed images look so crisp
The polar maps in the study were treated to bring the wave out. The team flattened the darkening near the planet’s edge and applied an unsharp mask to boost contrast. Most of the ground-based images were sharpened the same way (Sánchez-Lavega et al. 2026). That’s normal science practice, not a trick, but it means the decagon is subtler to the eye than the crisp outlines in the figures suggest. For more on when a space image is “enhanced” and what that means, see Are Space Photos Real?
Where Is the Decagon, and How Big Is It?
The decagon sits on the poleward side of a strong eastward jet stream. The jet’s peak is at 60.5°S, and the wave’s center in red light is at 63°S ± 0.4°. In the 889 nm methane band, which senses higher haze, the wave appears a little closer to the equator, at 60.5°S ± 0.4° (Sánchez-Lavega et al. 2026).
A wave, not a storm
It helps to be precise with words here. The decagon isn’t an isolated vortex, like Jupiter’s Great Red Spot. It’s a wave in a jet stream: a regular up-and-down bend in a band of clouds that wraps all the way around the pole. NASA’s release calls it a “10-sided atmospheric wave” that sits within one of Saturn’s jet streams (NASA Science). Each “corner” is a crest of that wave, and each “side” runs between two crests.
The numbers, carefully
- Wavelength: 16,782 ± 1,100 km (about 10,400 miles). This is the mean distance for one full wave cycle around the latitude circle. It is not the length of one side, and individual sides vary. For scale, that’s longer than Earth’s diameter of about 12,742 km (NASA NSSDC, Earth Fact Sheet).
- Amplitude: 2.7° ± 0.3° of latitude, about 2,645 km (about 1,640 miles). That’s how far north and south the wave swings, peak to peak.
- Overall band: roughly 53°S to 66°S, about 13,000 km (about 8,100 miles). A fainter decagonal pattern shows up in neighboring bands too, so the disturbance spans much of the jet’s width.
- Depth: from at least 10 millibars to 2 bars. The pattern appears at several altitudes, from the deeper clouds up into the haze. NASA puts it plainly: the decagon is “not just a cloud-level feature” (NASA Science).
All figures above are from the study (Sánchez-Lavega et al. 2026); the mile conversions are DCI’s arithmetic.
That last point matters. Because the wave shows up at different depths, its apparent position shifts slightly from filter to filter. Different colors of light probe different layers of Saturn’s atmosphere, so the “same” decagon sits at slightly different latitudes depending on which camera filter you look through.
Who Spotted It First?
Not a spacecraft, and not Hubble. The first hints came from backyard telescopes.
Amateurs and the PVOL archive
The University of the Basque Country in Spain runs the Planetary Virtual Observatory Laboratory (PVOL), a public archive where observers around the world upload planet images. In images there, first in 2024, lead author Agustín Sánchez-Lavega and amateur astronomers Trevor Barry and Jean-Paul Oger noticed a subtle wavy band near the south pole. Ground images from 2025 pointed even more strongly to a ten-sided shape (NASA Science).
Only then did the team go back to Hubble’s archive, and found the pattern in OPAL images as far back as October 2023. As Sánchez-Lavega put it, the Hubble data “confirmed the feature’s presence back to 2023” (NASA Science).
So the order is worth getting right: ground observers spotted it in 2024; Hubble’s archive shows it was already visible in 2023. Amateur images weren’t just a tip-off, either. The study used images from the ALPO Japan and PVOL databases, alongside Hubble, to track the corners through 2025.
Why nobody saw it sooner
Two reasons, one about geometry and one about the decagon itself.
Geometry. Saturn is tilted, so as it orbits the Sun, Earth sees more of one hemisphere and then the other. The study notes that Earth’s view of Saturn’s southern hemisphere ended in mid-2012, and the south only became visible again in 2023 (Sánchez-Lavega et al. 2026). For roughly a decade, telescopes on and around Earth simply couldn’t see the place where the decagon now sits.
The decagon itself. Cassini, which orbited Saturn from 2004 to 2017, could see the south. According to Sánchez-Lavega, its images “showed no inkling of a long-lived formation” there (NASA Science). The paper does mention one short-lived, partial polygon-like feature that Cassini caught in 2004, but nothing that lasted. The team also says it had been searching Hubble images for a southern counterpart to the hexagon since 1990.
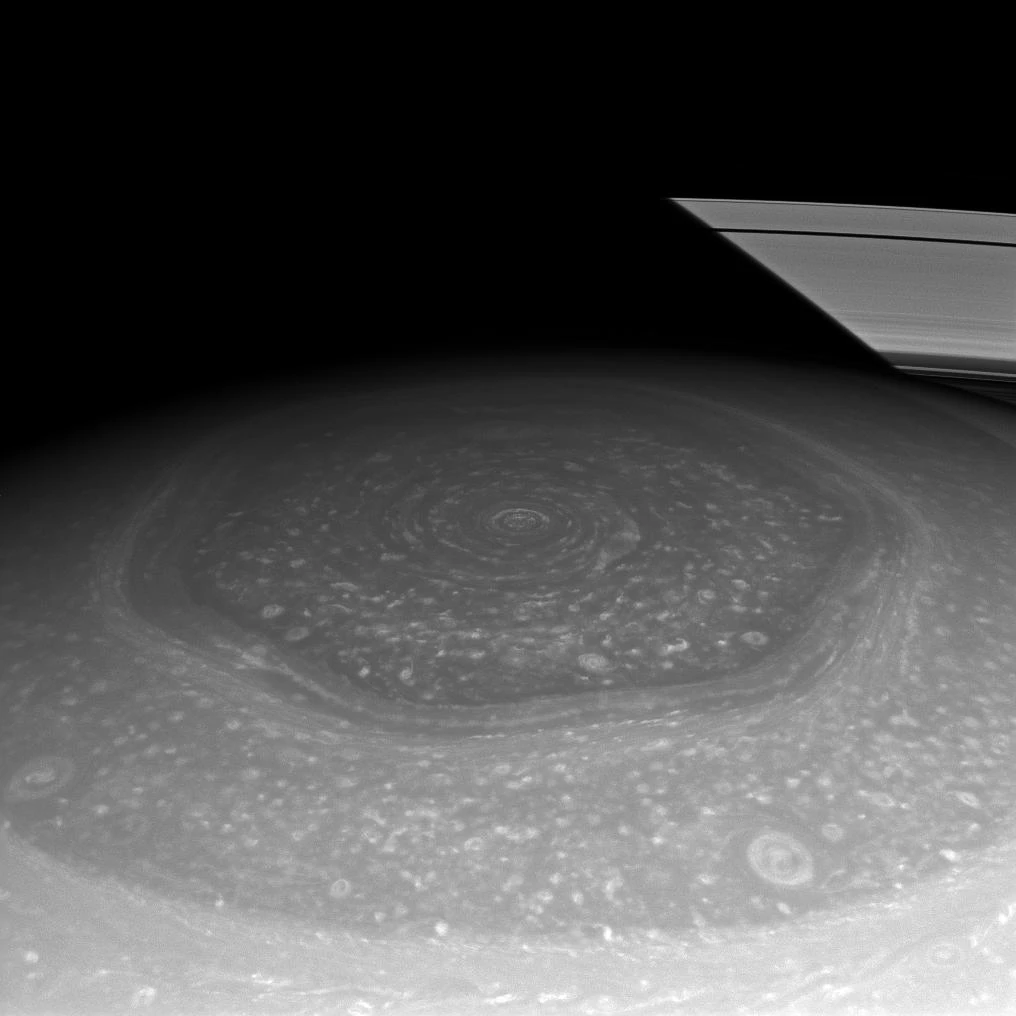
The paper goes one step further. It says the decagon “did not exist in Saturn’s previous year,” meaning one full Saturn orbit earlier, about 29.4 Earth years (Sánchez-Lavega et al. 2026; NASA, Saturn Facts). Put together, the evidence says this is a new feature. What it can’t say is when it formed: observational gaps prevent us from pinning that down.
How Fast Does the Decagon Move?
This is the strangest part of the story, and the reason for the river analogy at the top.
Racing wind, crawling pattern
Saturn has no solid surface, so scientists measure motion against a standard rotating reference frame called System III, based on Saturn’s radio signals. In System III, Saturn turns once every 10 hours, 39 minutes and 22.4 seconds (Sánchez-Lavega et al. 2026).
The team tracked all ten corners from June 26 to October 11, 2025, using Hubble and ground-based images. Relative to System III, the decagon drifted east at a mean 2.5 ± 0.2 m/s (about 9 km/h, or 6 mph). That works out to a rotation period for the pattern of 10 hours, 39 minutes and 1.8 seconds, about 20 seconds faster than System III.
Meanwhile, the jet underneath peaks at 116 m/s (about 418 km/h, or 260 mph). Measured against that peak, the pattern moves about 113 m/s westward, so the wind sweeps through the wave while the pattern itself nearly holds its place (Sánchez-Lavega et al. 2026).
Two cautions keep this honest. First, “barely moves” means barely moves relative to System III. The decagon still rotates with Saturn, once every ten and a half hours or so. Second, the 116 m/s figure is the jet’s peak speed, not the wind speed everywhere along the wave. At the decagon’s own latitude of 63°S, the study puts the pattern about 35 m/s slower than the local wind.
The northern hexagon behaves the same way: it sits on a jet of about 100 m/s yet stays nearly fixed in System III. The paper calls the two situations “analogous.”
The 32-day wobble
Here the decagon does something the hexagon has never been seen to do. Each corner swings back and forth in longitude around its average drift. The mean period of that swing is 32.5 days, with one corner at 43 days. The average swing is 4.6° of longitude, up to 8.4° at most. And the swings don’t happen in sync: the peak passes from one corner to the next with an average delay of 2.7 days (Sánchez-Lavega et al. 2026).
The authors compare it with a similar oscillation in Jupiter’s Great Red Spot, which has a period of about 90 days and an amplitude of about 1°. They call the decagon’s motion a “complex dynamical behavior, never observed in the hexagon” and flag it for future study.
Decagon vs. Hexagon: How Do Saturn’s Two Polygons Compare?
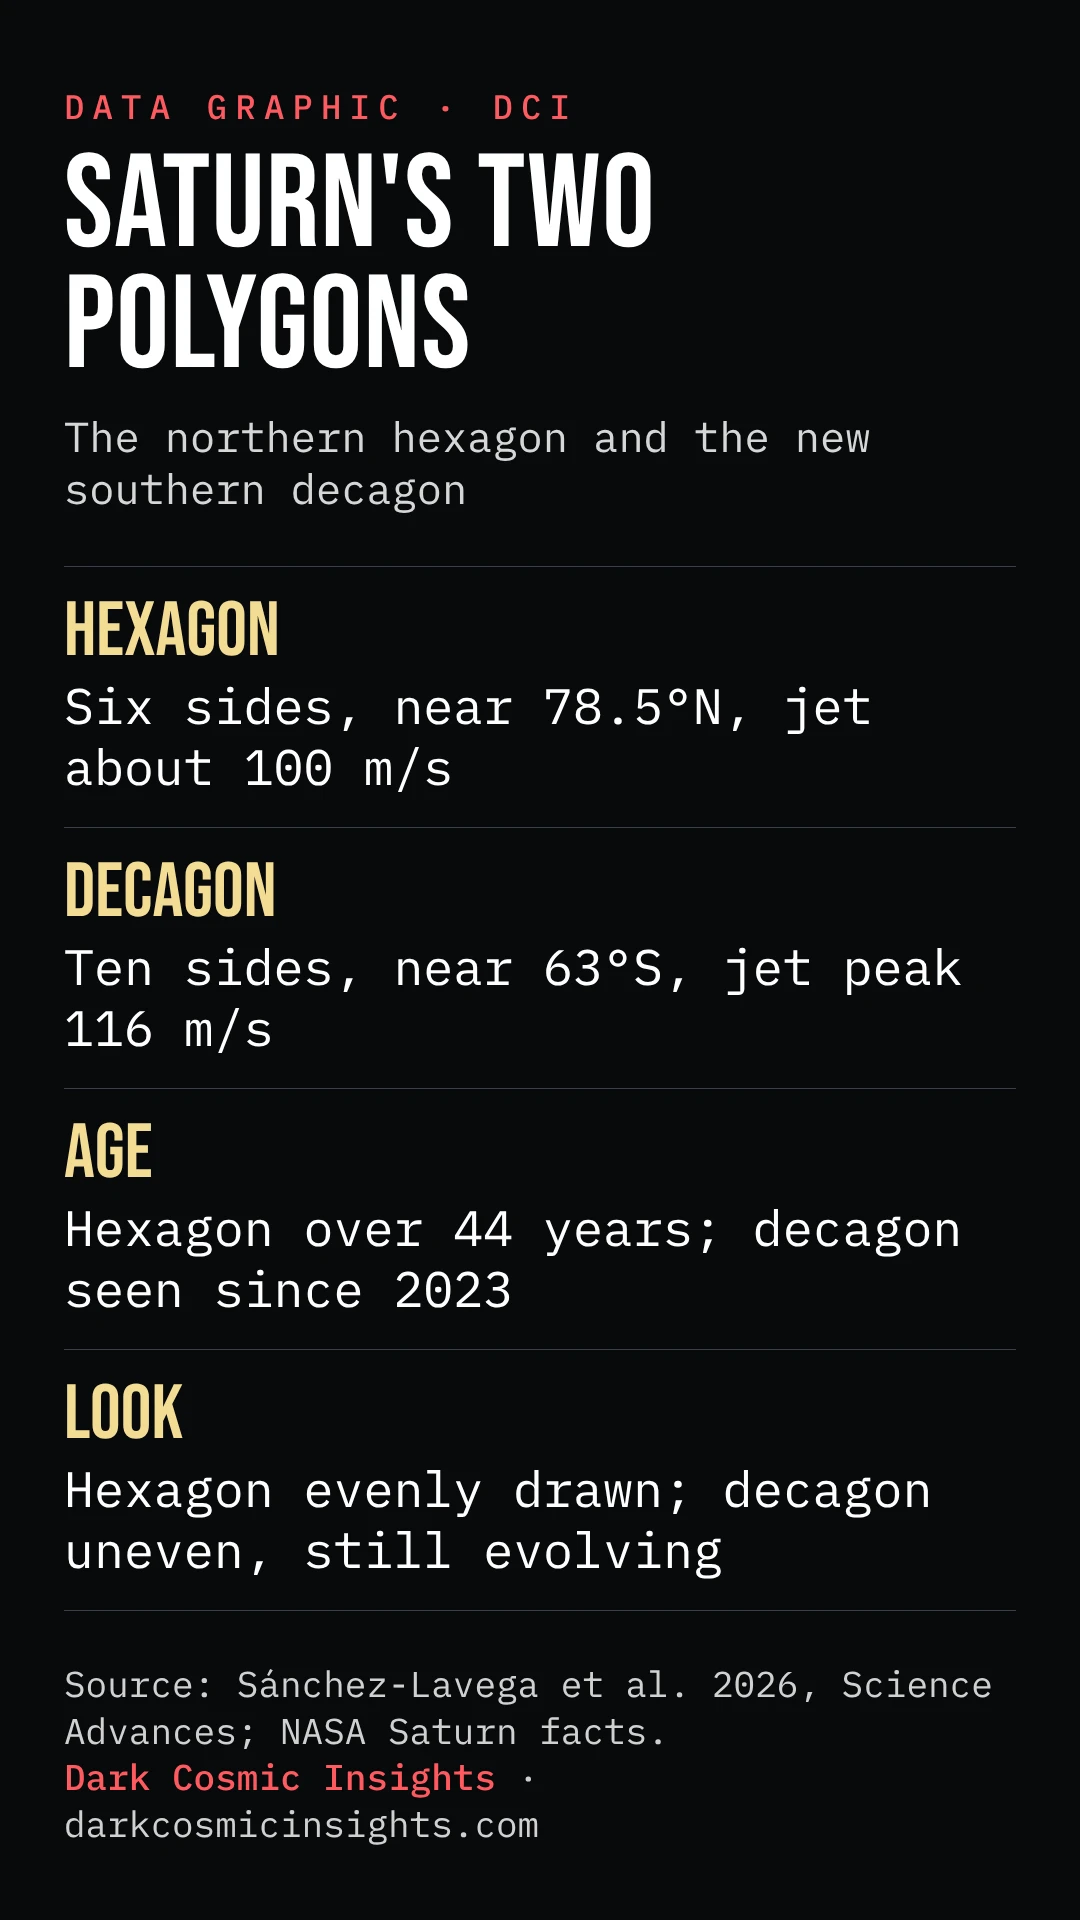
The hexagon is Saturn’s most famous weather pattern. It’s centered near 78.5°N, was found in Voyager images from 1980–1981, and has lasted for more than 44 years (Sánchez-Lavega et al. 2026). NASA describes it as spanning about 30,000 km (20,000 miles) across (NASA, Saturn Facts). For a deep dive on the hexagon itself, Code of Ascension has a full guide: Saturn’s Hexagon.
What they share
- Both are waves riding on eastward jet streams, not storms.
- Both stay nearly fixed relative to System III while much faster winds blow through them.
- Both reach through several layers of the atmosphere, not just the top clouds.
- The leading explanation for both is the same family of idea: a Rossby wave trapped by the jet.
What sets them apart
- Number of sides. Six versus ten.
- Latitude. The hexagon hugs the north pole at 78.5°N. The decagon sits much farther from the pole, around 63°S.
- Regularity. The hexagon’s sides and corners are equally contrasted. The decagon’s are not: some corners are bold, some faint.
- Age. The hexagon has been there every time anyone has looked for over four decades. The decagon was absent a Saturn year ago and appears to be developing.
- The wobble. The decagon’s 32.5-day corner oscillation has never been seen in the hexagon.
Amy Simon, OPAL’s principal investigator at NASA Goddard, summed up the contrast: the hexagon “has been there every time we’ve looked,” while the decagon is different, appearing to strengthen (NASA Science). Curious how Saturn’s north pole compares with Jupiter’s? See Jupiter’s Polar Cyclones vs. Saturn’s Hexagon.
Why Would a Jet Stream Bend Into a Polygon?
Straight lines and sharp corners look out of place in a swirling atmosphere. But on a fast-spinning planet, the physics actually favors them.
Rossby waves, briefly
On a rotating planet, the spin’s effect on moving air changes with latitude. That change lets large, slow meanders called Rossby waves form in jet streams. Earth’s jet stream meanders in a similar way, which is part of why weather patterns shift as they do.
The study finds the decagon’s jet is in geostrophic balance, a state where the planet’s rotation and pressure forces roughly cancel. It also finds the jet’s sharp curvature in wind speed is about eight times stronger than the background effect of Saturn’s spin. With those numbers, the authors propose the decagon “could be” a Rossby wave trapped vertically and confined in latitude by the jet’s curvature, the same idea proposed for the hexagon (Sánchez-Lavega et al. 2026). That’s a model-based explanation, not a direct observation.
Because the decagon is uneven and seems to be developing, they add one more idea: it may result from an instability in the jet in the upper weather layer. If so, it “could be a transient evolving phenomenon,” while the hexagon is a robust, long-lived wave.
Three test runs in a simple model
To explore this, the team ran a shallow-water model, a stripped-down, single-layer stand-in for Saturn’s atmosphere. The authors call it a “zero-order exploration.” They tried three setups (Sánchez-Lavega et al. 2026):
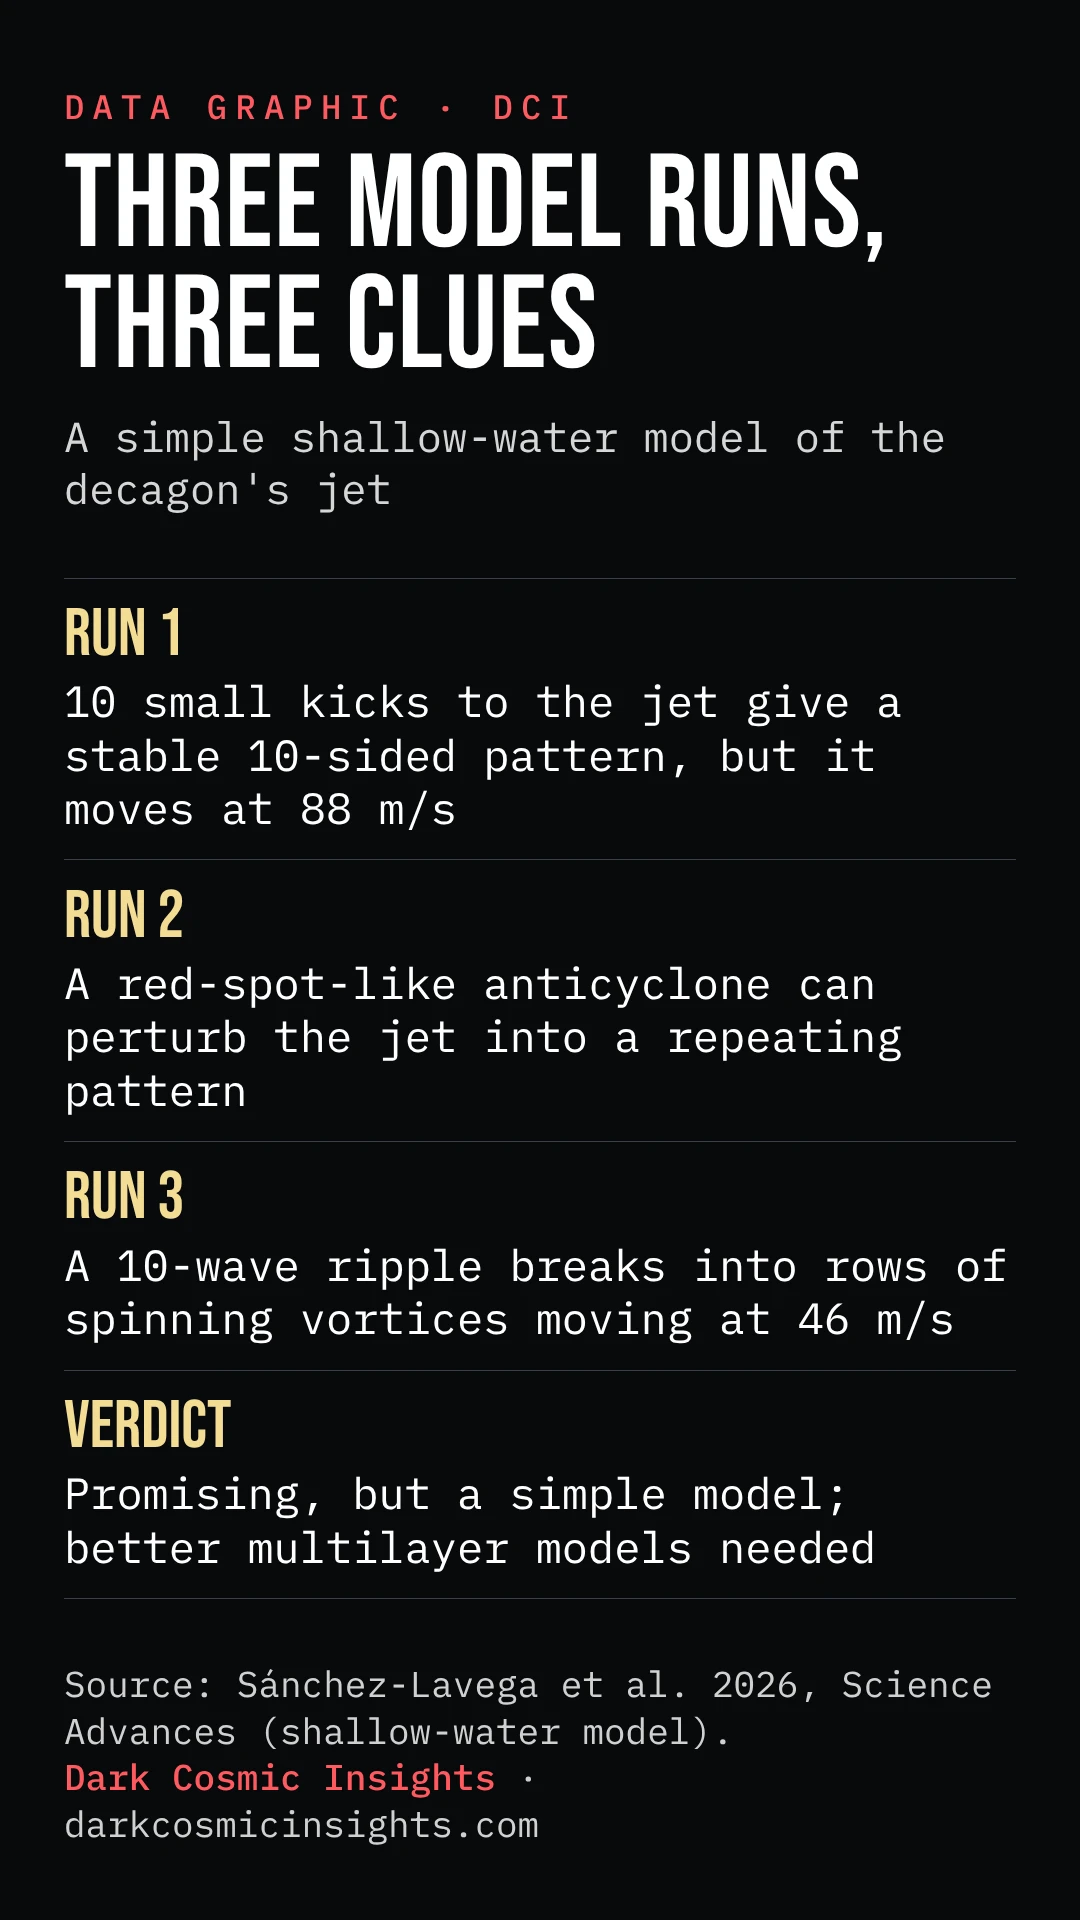
- Ten small disturbances. Ten evenly spaced kicks to the jet settled into a stable ten-sided pattern. But it moved at 88 m/s (about 197 mph), far faster than the real decagon. With fewer kicks, the jet relaxed into a polygon with that many sides.
- A red anticyclone. Adding a spinning storm like the one observed nearby could perturb the jet and generate a repeating pattern, depending on the settings.
- A ten-wave ripple. A sine-wave ripple with ten crests quickly broke up into rows of anticyclones and cyclones on either side of the jet, moving at 46 m/s (about 103 mph). That’s slower than the jet peak but still faster than the decagon.
None of the runs matched the real decagon perfectly. The authors call the results “promising” and say the next step is more advanced, multilayer models. That’s the honest status: modelled, not settled.
What About the Red Spot Next to the Decagon?
There’s a second character in this story. From 2023 to 2025, a red spot sat at 55°S, just north of the decagon. It was about 4,000 km (about 2,500 miles) across and moved at 23 ± 1 m/s (about 51 mph). Based on Saturn’s wind profile, it’s an anticyclone, a high-pressure spinning storm (Sánchez-Lavega et al. 2026).
The decagon’s boldest corners are near this spot, and the faintest stretch is on the opposite side of the pole. That’s suggestive, but the paper is careful: the spot’s role in forming the decagon “remains unclear.” The model run with an anticyclone means the team “cannot therefore rule out” that the spot is ultimately the cause, and the decagon might even outlast it.
History offers an echo. During the Voyager encounters in 1980 and 1981, the spacecraft photographed a similar spot in the north, informally nicknamed “Anne’s spot,” close to where the hexagon sits. Whether that spot had anything to do with the hexagon was also unclear at first. Status today for the red spot and the decagon: open.
What Don’t Scientists Know Yet?
The decagon is new enough that the list of unknowns is longer than the list of answers.
- When exactly did it form? The study says it wasn’t there a Saturn year ago, and Hubble shows it in October 2023. Observational gaps, including Earth’s blocked view of the south from mid-2012 to 2023, prevent us from pinning down when it formed.
- What started it? A jet instability, the red anticyclone, or something else. Simon framed the core puzzle as “why did it suddenly form now when we haven’t seen one before?” (NASA Science)
- Will it last? It may settle into a stable shape like the hexagon, or keep changing and fade. The team says it could be transient.
- What drives the 32.5-day wobble? No one has an answer yet.
- Does it show up in temperatures? Infrared images from ESO’s Very Large Telescope on August 16–17, 2025 didn’t show clear decagon corners, probably because of the steep viewing angle. They did show banding, with one temperature band lining up with the decagon region (Sánchez-Lavega et al. 2026).
- Does it hide smaller vortices? One model run suggests rows of spinning vortices might line the wave, too small for current images to resolve.
The team plans more Hubble observations, and says further study with NASA’s James Webb Space Telescope and computer models is needed (NASA Science).
Myth vs. Fact: Saturn’s Decagon
| Myth | Fact | Status |
|---|---|---|
| “Saturn grew a giant ten-sided storm.” | It’s a wave in a jet stream, not a storm. | Not supported |
| “Each side is 16,800 km long.” | 16,782 km is the mean wavelength of one wave cycle, not a side length. | Measured |
| “The decagon is motionless in space.” | It drifts 2.5 m/s east relative to System III, and still turns with Saturn. | Measured |
| “The winds in the decagon blow at 116 m/s.” | 116 m/s is the jet’s peak at 60.5°S; the wind varies across the wave. | Measured |
| “Hubble discovered it in 2025.” | Ground observers spotted it in 2024; Hubble images show it was visible in 2023. | Observed |
| “It formed in 2023.” | The formation date is unknown; the south was hidden from Earth’s view from mid-2012 to 2023. | Open |
| “Scientists know what caused it.” | The leading idea is a trapped Rossby wave, possibly from a jet instability, but the cause is unresolved. | Open |
How Can You Follow the Decagon Yourself?
You don’t need a spacecraft to keep tabs on this one. Amateurs helped find it, and the data is public.
Check the archives
- PVOL, the Planetary Virtual Observatory Laboratory, collects Saturn images from observers worldwide. It’s where the first hints turned up (PVOL).
- OPAL data from Hubble is archived for the public at STScI’s MAST (OPAL High Level Science Product).
- NASA’s release includes a color image and a single-filter view with the decagon labeled (NASA Science).
Watch for updates
The team plans to keep observing Saturn to see whether the decagon settles down or keeps evolving. Hubble’s yearly OPAL views are the best bet for a fresh look. If the decagon is still there in a few years, it starts to look like a southern hexagon. If it fades, it becomes a rare record of a planetary pattern that came and went. Either way, it’s worth watching.
Saturn’s Decagon by the Numbers
| Measure | Value | Source |
|---|---|---|
| Number of sides | 10 | Sánchez-Lavega et al. 2026 |
| Wave center (red filters) | 63°S ± 0.4° | Sánchez-Lavega et al. 2026 |
| Wave center (889 nm methane band) | 60.5°S ± 0.4° | Sánchez-Lavega et al. 2026 |
| Mean wavelength | 16,782 ± 1,100 km (about 10,400 mi) | Sánchez-Lavega et al. 2026 |
| Peak-to-peak amplitude | 2.7° ± 0.3° (2,645 km, about 1,640 mi) | Sánchez-Lavega et al. 2026 |
| Latitude span of the pattern | about 53°S to 66°S (about 13,000 km) | Sánchez-Lavega et al. 2026 |
| Pressure range | at least 10 mbar to 2 bar | Sánchez-Lavega et al. 2026 |
| Drift relative to System III | +2.5 ± 0.2 m/s eastward (June–Oct 2025) | Sánchez-Lavega et al. 2026 |
| Jet peak speed | 116 m/s at 60.5°S | Sánchez-Lavega et al. 2026 |
| Corner wobble period | 32.5 days mean (one corner 43 days) | Sánchez-Lavega et al. 2026 |
| First Hubble image showing it | October 22, 2023 | Sánchez-Lavega et al. 2026 |
| Study published | September 2, 2026, Science Advances | NASA Science |
Values are as of November 2026; mile conversions are DCI’s arithmetic.
Saturn’s Decagon: FAQ
Is the decagon a storm on Saturn?
No. It’s a ten-sided wave in a jet stream near Saturn’s south pole, not an isolated vortex. NASA describes it as a “10-sided atmospheric wave.” It shows up as a regular bend in a band of clouds that circles the pole.
How big is each side of the decagon?
The study doesn’t give a single side length. It gives a mean wavelength, the distance for one full wave cycle around the latitude circle, of 16,782 ± 1,100 km, about 10,400 miles. That’s longer than Earth is wide. The sides are uneven, so no single number fits all ten.
Who discovered Saturn’s decagon?
Lead author Agustín Sánchez-Lavega and amateur astronomers Trevor Barry and Jean-Paul Oger first noticed a wavy band in ground-based images in 2024. Hubble’s archive then showed the pattern was already visible in October 2023. The study was published in Science Advances on September 2, 2026.
Does the decagon spin with Saturn?
Yes. It drifts just 2.5 m/s east relative to System III, Saturn’s standard rotation frame, so it rotates almost exactly with the planet, about once every 10 hours and 39 minutes. What makes it strange is that the jet beneath it peaks at 116 m/s.
Why didn’t Cassini see the decagon?
Cassini orbited Saturn from 2004 to 2017 and saw “no inkling of a long-lived formation” in the south, only a short-lived partial polygon in 2004. The study also says the decagon did not exist in Saturn’s previous year. The evidence points to a new feature, but its exact start date is unknown.
Will the decagon last as long as the hexagon?
No one knows yet. The hexagon has lasted more than 44 years. The team says the decagon may be a transient, evolving feature, and plans more Hubble observations to see whether it settles down or keeps changing.
Can backyard telescopes show the decagon?
Experienced amateur imagers helped find it, using sharpened images from their telescopes, so yes, it’s within reach of skilled observers. It’s subtle, though. A casual look through a small telescope won’t show ten sides. The best way to see it is through archive images on PVOL and NASA’s release.
Does any other planet have a ten-sided pattern?
Not that the study reports. The paper says no similar wave had been reported in Saturn’s southern hemisphere or elsewhere on Saturn. Jupiter has clusters of cyclones arranged in polygon-like patterns at its poles, but those are groups of separate storms, not a single wave.
Your next step: open NASA’s release and look at the single-filter image labeled “F763M.” Count the corners yourself, then compare them with Cassini’s view of the northern hexagon. Seeing both polygons side by side is the fastest way to understand what makes the decagon new.
Sources and Further Reading
- Sánchez-Lavega, A., Simon, A. A., Wong, M. H., Fletcher, L. N., Antuñano, A., & Hueso, R. (2026). A decagon wave around Saturn’s south pole. Science Advances, 12(36), eaee4251. doi:10.1126/sciadv.aee4251
- NASA Science (September 2, 2026; updated September 8, 2026), NASA’s Hubble Tracks New Decagon Encircling Saturn’s South Pole.
- ESA/Hubble (September 2026), heic2612, the European release of the same result; images heic2612a and heic2612b, CC BY 4.0.
- NASA Science, Saturn Facts (updated October 15, 2026).
- NASA Space Science Data Coordinated Archive, Earth Fact Sheet.
- NASA Science (December 9, 2024), NASA’s Hubble Celebrates Decade of Tracking Outer Planets.
- STScI MAST, Outer Planet Atmospheres Legacy (OPAL) High Level Science Product.
- University of the Basque Country, Planetary Virtual Observatory Laboratory (PVOL).
- NASA Photojournal, PIA14646: Hexagon and Rings (Cassini, 2013).
- Code of Ascension, Saturn’s Hexagon.
Explore Next
- The full Saturn guide: Saturn: Facts, Rings, Moons and Your Questions
- Seven, eight or thousands: How Many Rings Does Saturn Have?
- Why Saturn looks pale gold, and why its poles turn blue: What Color Is Saturn?
- Distance, travel time and the 29-year Saturn year: How Far Is Saturn?
- Size, mass and the bathtub question: How Big Is Saturn?
- Saturn’s north pole next to Jupiter’s: Jupiter’s Polar Cyclones vs. Saturn’s Hexagon
- Saturn’s huge family of moons: How Many Moons Does Saturn Have?
- NASA’s helicopter for Saturn’s biggest moon: Titan and Dragonfly
- How enhanced and processed images work: Are Space Photos Real?
- The same target in visible and infrared light: Hubble vs. Webb
- Every planet, its moons and our guides: Solar System Explorer
- How a claim earns its label: How We Know
How This Explainer Was Checked
Every number in this article was checked in November 2026 against the source linked beside it, mainly the peer-reviewed study by Sánchez-Lavega and colleagues in Science Advances (2026), read in full, plus NASA’s September 2, 2026 release, NASA’s Saturn facts and the NSSDC Earth fact sheet. The decagon’s appearance is labelled Observed; its latitude, wavelength, amplitude, drift, wobble and the jet speed are labelled Measured, with the paper’s uncertainties; the Rossby-wave explanation and the shallow-water model runs are labelled Modelled; its cause, the red spot’s role, its formation date and its future are labelled Open; the claim that it’s a storm is labelled Not supported. The 16,782 km figure is described as a mean wavelength, not a side length, and the 2.5 m/s drift as relative to System III, as the paper gives them. Mile and km/h conversions are DCI’s arithmetic. Hubble’s decagon images are reproduced from ESA/Hubble under CC BY 4.0 with their full credit line. Images are labelled: real spacecraft images as OBSERVATION, illustrations as ILLUSTRATION, and our charts as DATA GRAPHIC. Nothing AI-generated is presented as a real image.
Final Thought: A Pattern Still Taking Shape
The hexagon was already old when we found it, and it has looked much the same every time anyone has checked. The decagon is different. We don’t know when it formed, but Hubble’s yearly views show it becoming clearer from 2023 to 2025, and NASA says it appears to be strengthening. Whether it settles into a southern twin of the hexagon or fades back into the jet, we’ll get to watch it happen. And some of the first eyes on it belonged to people with backyard telescopes.
About the Author
Author: King | Founder of Dark Cosmic Insights
King is the founder of Dark Cosmic Insights, a science storytelling platform exploring the strangest true stories hiding in space, science and AI. He digs into NASA, ESA and peer-reviewed research, separates what has been measured from what is still a mystery, and turns it into articles, data graphics and Shorts.
Follow the anomaly. Trace the source.