Some space images record visible light. Others translate light our eyes cannot see. A few are paintings. Here is how to tell exactly what you are looking at, and why the honest answer to “are space photos real?” is more interesting than yes or no.
A nebula glows turquoise. A planet burns red. A galaxy appears in colors you have never seen through a backyard telescope. It is a fair question: are space photos real, or are we looking at something someone made on a computer?
Most of the time you are looking at real measurements that have been processed into an image you can understand. But the label matters. A photograph, a false-color composite, a simulation and an artist’s concept can all appear in the same science story while showing very different kinds of information. The useful question is not simply whether an image was edited. It is what was measured, what was changed, and what the image claims to show. This guide gives you a decoder for all of it, walks through how NASA turns Webb data into pictures, and ends with a five-step check you can use on any space image that crosses your feed.
In this guide
- Quick Answer: Are Space Photos Real?
- The DCI Space Image Evidence Map
- The DCI Space Image Decoder
- Does “False Color” Mean the Image Is Fake?
- How a Telescope Observation Becomes a Color Image
- Inside Webb’s Pipeline: Why Raw Data Looks Black
- What Does “Natural Color” Mean?
- Why Are Webb Images Colored If Infrared Is Invisible?
- A Real Example: The Pillars of Creation
- Why Do Stars in Webb Images Have Eight Spikes?
- Does Composite Mean Fake?
- What Is an Artist’s Concept?
- Would Space Look This Colorful to My Eyes?
- How to Check a Space Image in Five Steps
- What About AI-Generated Space Images?
- Myth vs. Fact: Space Photo Edition
- Space Images by the Numbers
- Frequently Asked Questions
- Sources
- Keep Exploring
- How This Explainer Was Checked
Quick Answer: Are Space Photos Real?
Quick Answer: Yes, most space photos from NASA, ESA and other observatories are built from real light recorded by real instruments. But they are usually processed: raw exposures are cleaned, brightened, and combined, and each filter is given a display color. Webb images in particular translate infrared light, which human eyes cannot see, into visible colors, so they are not what you would see through a window. Some images in science news are not photos at all: artist’s concepts and simulations illustrate ideas. The caption tells you which is which.
What this article can and cannot establish: We can explain how professional space images are made and labeled, using NASA, ESA/Webb and Smithsonian sources, and show real examples with their filter lists. We can’t vouch for any image you find on social media without its original source, and we can’t tell you how a given object would look to the naked eye unless an observatory has published that comparison.
The DCI Space Image Evidence Map
Different kinds of space images support different kinds of claims. This map sorts the common ones by what they can actually prove.
| Image type | What it records | Status | Can it show what the object looks like? |
|---|---|---|---|
| Raw telescope frame | Light counts per pixel through one filter | Measured | No. It looks almost black and gray until processed |
| Natural-color image | Visible light, balanced to approximate human vision | Measured + processed | Approximately, with caveats |
| Representative (false) color image | Light outside human vision, mapped to visible colors | Measured + translated | No. It shows structure our eyes can’t see |
| Composite or mosaic | Several filters, exposures, tiles or instruments combined | Measured + combined | Partly. Check dates and ingredients |
| Spectrum or data plot | Brightness at each wavelength | Measured | No. It shows chemistry, not appearance |
| Simulation | Output of a physical model | Modelled | Only as good as its inputs |
| Artist’s concept | An artist’s picture of a possible scene | Illustration | No. Informed by data, but not a photo |
| AI-generated image | Pixels predicted by a generative model | Illustration | No. Never evidence of a real object |
Cite this framework: Dark Cosmic Insights, “Space Image Evidence Map,” darkcosmicinsights.com, 2026.
The DCI Space Image Decoder
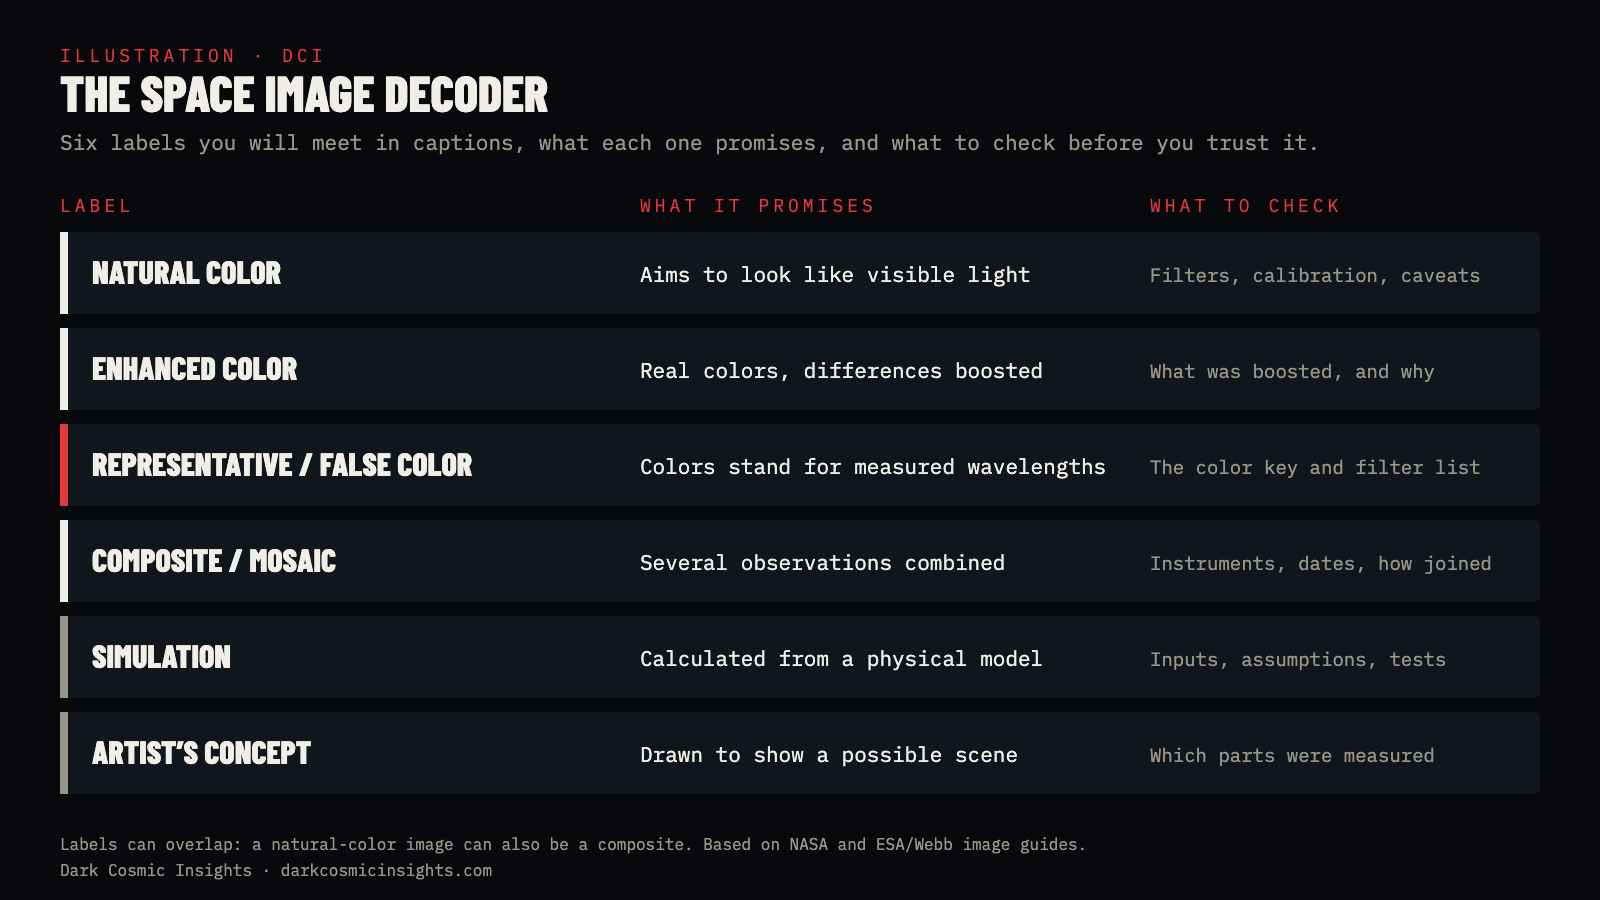
Captions on observatory websites use a small set of labels. Each one answers a different question, and they can overlap: a natural-color image can also be a composite, and a representative-color image may combine several observations from one instrument or from several observatories.
| Label | What it usually tells you | What to check |
|---|---|---|
| Natural color or approximately true color | The display aims to resemble visible-light colors | Filters, calibration and the caption’s qualifications |
| Enhanced color | Differences in brightness or color have been emphasized | What was enhanced and why |
| False color or representative color | Display colors stand for selected wavelengths or other measured quantities | The color key and filter assignments |
| Composite or mosaic | Multiple observations or image pieces were combined | Instruments, dates, wavelengths and how they were combined |
| Simulation | A model was used to calculate a scene or behavior | Assumptions, inputs and the observations used to test it |
| Artist’s concept or illustration | An artist depicts a possible scene, often informed by evidence | Which details are measured and which are illustrative |
Does “False Color” Mean the Image Is Fake?
No. The word “false” sounds like a warning that the object was invented. In astronomy it means something much narrower: the colors on your screen differ from the colors a human eye would register. The data underneath can be entirely observational.
Think of a weather radar map or a topographic map. Nobody believes the ground is literally blue at one altitude and orange at another, but the colors communicate a real measurement. A false-color space image works the same way, and like a map, it needs a legend. That legend is the caption’s list of filters and color assignments. Many astronomers prefer the term representative color for exactly this reason.
The same idea shows up far from astronomy. Scientists find traces of an ancient pigment on museum objects by photographing them in infrared, where it glows, then showing that glow in a color we can see. Read how in How Scientists Detect Egyptian Blue.
How a Telescope Observation Becomes a Color Image
A telescope is built to measure light. Producing a striking picture for a screen is a later, separate step.
Space telescope cameras don’t take color photos the way your phone does. They record one band of light at a time through a filter that lets in a particular range of wavelengths. Each exposure is a grid of numbers: how much light hit each pixel. Displayed on its own, that grid appears in shades of gray.
An imaging specialist then assigns a visible color to each filtered image and stacks the layers. Where the layers differ, the final picture shows different colors. Before and after that, there is calibration and cleanup. Detectors have faulty pixels. Cosmic rays strike the sensor and leave bright specks. Several exposures need aligning. And brightness has to be stretched so that faint structures are visible next to bright stars.
NASA’s explanation of Webb image processing describes these stages, including the choices involved in picking filters, removing artifacts and assigning colors. ESA/Webb’s guide explains how exposures can be stacked for a clearer view or stitched into larger mosaics. Those choices affect what you notice first. A responsible image release documents the underlying observations and explains the presentation, rather than pretending every image is an untouched snapshot.
Inside Webb’s Pipeline: Why Raw Data Looks Black
Here is a detail that surprises most people. According to NASA, Webb’s raw telescope images “initially appear almost completely black” (NASA). The data is not empty. Webb’s detectors record an enormous range of brightness, with each pixel able to take one of more than 65,000 shades of gray. A screen can only show a tiny slice of that range at once, so the faint dust and distant galaxies sit in the darkest values. Stretching the brightness is what pulls them into view.
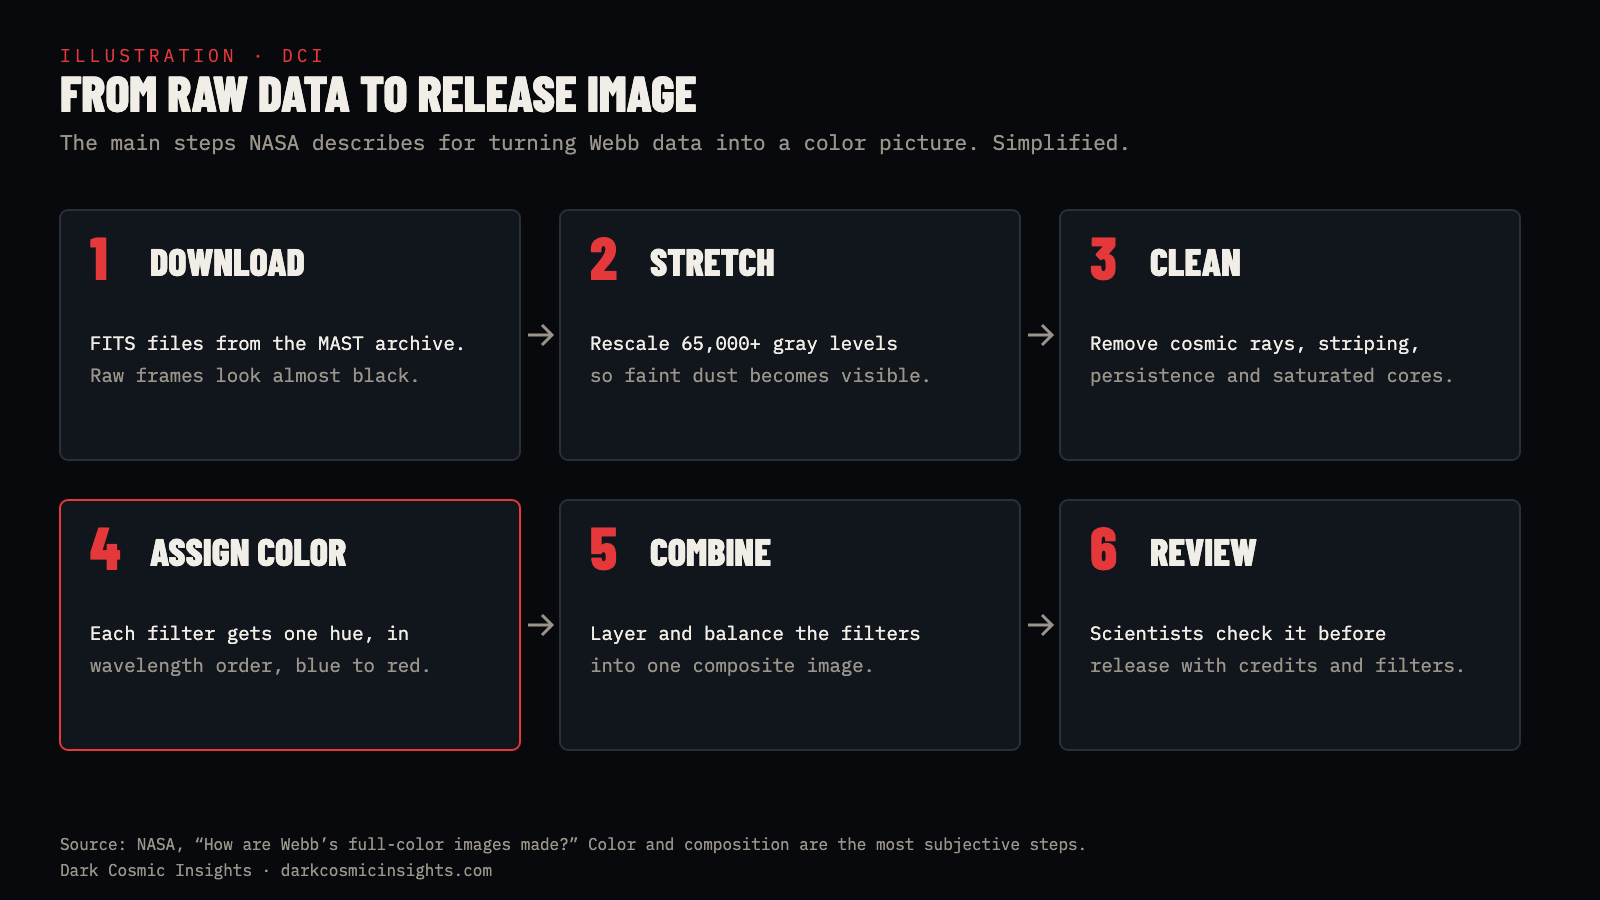
The process, as NASA describes it, runs roughly like this:
- Download. Webb data is archived in the Mikulski Archive for Space Telescopes (MAST) as FITS files, a standard astronomy format. A single file can run from about 140 MB to 5 GB (NASA).
- Stretch. Specialists rescale the brightness so detail across the whole range becomes visible.
- Clean. They remove artifacts: black cores where bright stars saturated the detector, faint striping known as 1/f noise, “persistence” left over from earlier bright exposures, and cosmic-ray hits.
- Assign color. Webb’s NIRCam has 29 filters and MIRI has 9. A typical composite uses four or five NIRCam filters, or three or four from MIRI. Each one gets a hue.
- Combine and compose. The colored layers are blended and balanced. NASA calls composition the most subjective step, the point where aesthetic judgment matters most.
- Review. Scientists check the image before it is released, so the picture doesn’t imply something the data doesn’t support.
Webb’s science data is usually reserved for the team that proposed the observation for about a year before it becomes public. After that, anyone can download the same files from MAST and make their own image, which is why you sometimes see amateur versions of famous Webb targets. To compare how Webb and Hubble see the same object, read Hubble vs. Webb: Same Nebula, Different Views.
What Does “Natural Color” Mean?
A natural-color image generally uses visible-light observations and processing intended to approximate the colors a person would recognize.
That does not make it a perfect recreation of standing next to the object. Camera sensitivity, exposure time, viewing conditions, calibration and the display you are using all influence the result. “Approximately true color” is often a more honest promise than “exactly what your eyes would see.”
Hubble can observe visible light as well as some ultraviolet and near-infrared light, so its images don’t all get the same treatment. Some combine broad visible-light filters in a way that approximates natural color. Others use narrow wavelength bands, such as the specific red glow of hydrogen, or light outside human vision, with colors assigned to reveal particular features. The instrument and filter list matter more than the telescope’s name.
Spacecraft images of planets follow the same rule. A view of Jupiter or Saturn may be enhanced to bring out cloud bands that would look subtle to the eye. When we compared the giant storms at each planet’s poles, the most useful images were exactly those enhanced views; see Jupiter’s Polar Cyclones vs. Saturn’s Hexagon.
Why Are Webb Images Colored If Infrared Is Invisible?
The James Webb Space Telescope observes mainly infrared light. Human eyes see from roughly 0.4 to 0.7 microns. Webb’s NIRCam covers about 0.6 to 5 microns and MIRI about 5 to 28 microns, almost all of it beyond what we can see. Any color image on your screen is therefore a translation.
For most Webb releases, NASA uses what it calls chromatic ordering: the shortest infrared wavelength gets the bluest color and the longest gets the reddest (NASA). That keeps the familiar logic of the rainbow while shifting the information into colors we can see. When near-infrared and mid-infrared images are combined, the color assignments can be woven together differently to highlight useful structures.
So there is no universal rule that a red pixel means the same thing in every space picture. Red might represent one infrared filter in one release and a different wavelength in another. You cannot identify a chemical by looking for a familiar color in an unlabeled image. The same caution applies to temperature: a warm-looking color does not automatically mean a hotter region. That relationship has to be established by the data and the legend.
A Real Example: The Pillars of Creation
The Pillars of Creation, about 6,500 light-years away in the Eagle Nebula, are an excellent test case because Webb has shown them through both its Near-Infrared Camera (NIRCam) and its Mid-Infrared Instrument (MIRI). In the NIRCam view, countless stars stand out around the dusty columns. The MIRI view gives the dust a very different emphasis and hides most of the stars. The landscape looks different because the instruments sample different parts of the infrared spectrum.
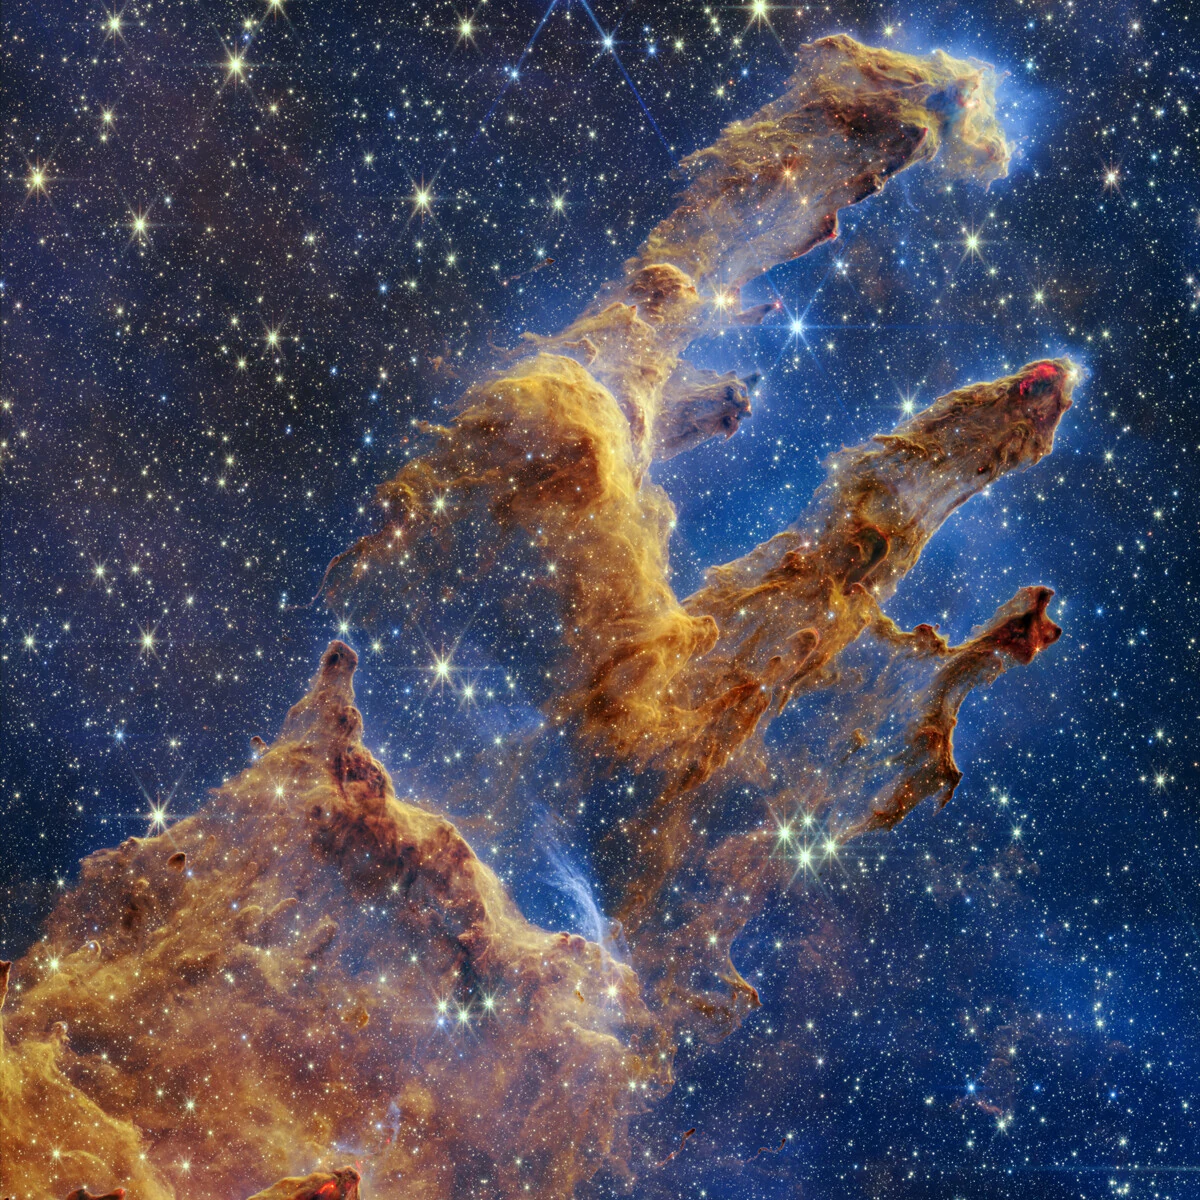
ESA/Webb’s release lists exactly how the NIRCam image was colored (ESA/Webb). Six filters were used, from 0.9 to 4.7 microns, and each got a color in wavelength order. Two are narrow filters chosen for specific chemistry: one tuned to glowing hydrogen and one to molecular hydrogen, which traces young stars blasting material into the pillars. Another catches the glow of carbon-rich dust molecules.
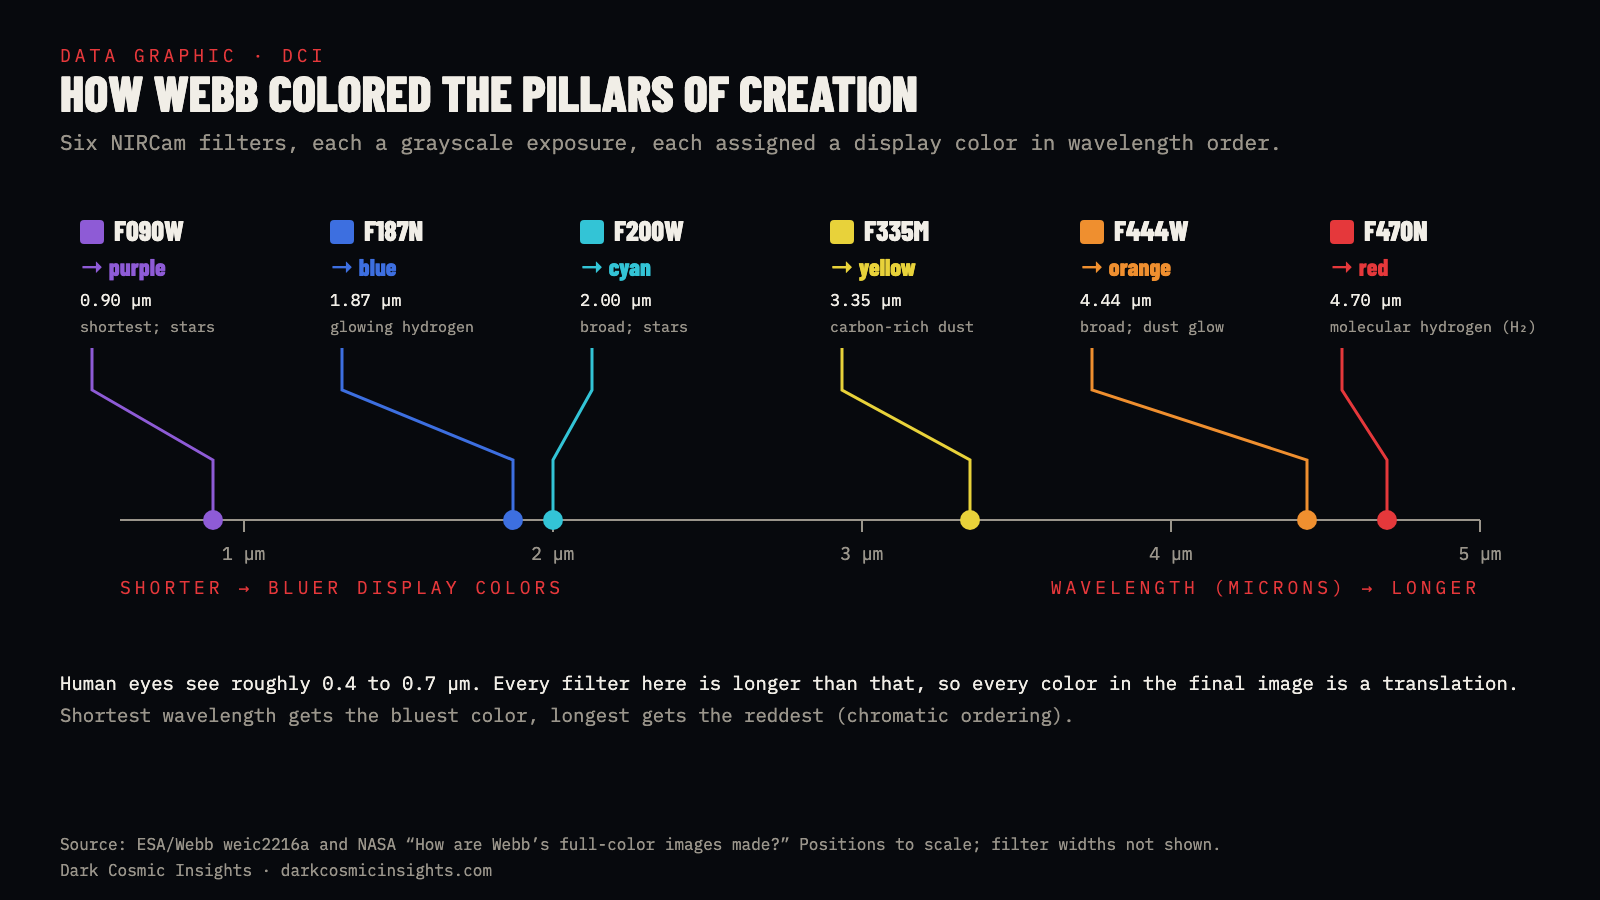

NASA also released a combined NIRCam and MIRI image. Its caption lists the instruments, observation date, filters and color assignments, and explains that the near-infrared data contributes many of the stars while the mid-infrared data reveals the dust. This is a composite of observations, not a stage set lit with colored lights. It also shows why “which picture is the real one?” is the wrong starting question. Each instrument reveals a different physical feature of the same region. The most informative view depends on what you want to know.
Why Do Stars in Webb Images Have Eight Spikes?
Look closely at bright stars in almost any Webb image and you’ll see a pattern of sharp points: six big ones and two smaller horizontal ones. People sometimes take these as proof of editing. They are the opposite. They are a fingerprint of the telescope itself.
Light bends slightly as it passes edges, an effect called diffraction. Webb’s primary mirror is made of 18 hexagonal segments, and the straight edges of those hexagons send bright light out in six directions. The three struts that hold the secondary mirror add their own spikes, and they were designed so most of these overlap the mirror’s. The leftover pair from the vertical strut gives the two small horizontal points (NASA/STScI). Hubble, with a round mirror and four straight supports, makes the familiar four-pointed star.
Because the spike pattern comes from Webb’s hardware, it keeps the same orientation in nearly every Webb release. That makes spikes a useful quick check. A “Webb image” in which stars have four points, or no points at all, is either from another telescope, heavily reprocessed, or not a telescope image at all.
Does Composite Mean Fake?
A composite combines information. That description alone tells you nothing about whether the result is accurate or misleading. There are good reasons to combine observations:
- Different filters reveal different wavelength ranges.
- Repeated exposures make faint structures visible and help identify artifacts.
- A mosaic covers an area larger than the camera can capture in one frame.
- Several instruments provide complementary views.
- Observations from different dates build a broader map or show change over time.
What matters is disclosure. A composite assembled over months shouldn’t be described as one photograph of a single instant. Consider Earth’s famous Blue Marble images. NASA’s 2002 Blue Marble release openly describes a mosaic assembled from satellite data, with separate sources for land, oceans, sea ice and clouds. Its land data spans months, and its cloud layer combines several days. That makes it a superb global visualization, but it would be misleading to call it one camera exposure. NASA distinguishes it from the Apollo 17 photograph taken by astronauts in 1972. Check which Blue Marble someone means; the name has been used for several different images.
What Is an Artist’s Concept?
An artist’s concept depicts a scene rather than recording it. It may be informed by measurements, physical models and expert review, but its detailed appearance goes beyond what has been observed. This matters most for exoplanets. A beautiful close-up of an alien ocean or a lava world often accompanies research based on a spectrum, a dip in starlight or another indirect measurement.
For example, NASA’s TOI-421 b illustration is labeled an artist’s concept. The page explains that it is based on spectroscopic data and earlier observations, and states plainly that Webb has not captured any images of that planet. That statement doesn’t erase the observations. It tells you which part of the story is measurement and which part is visualization.
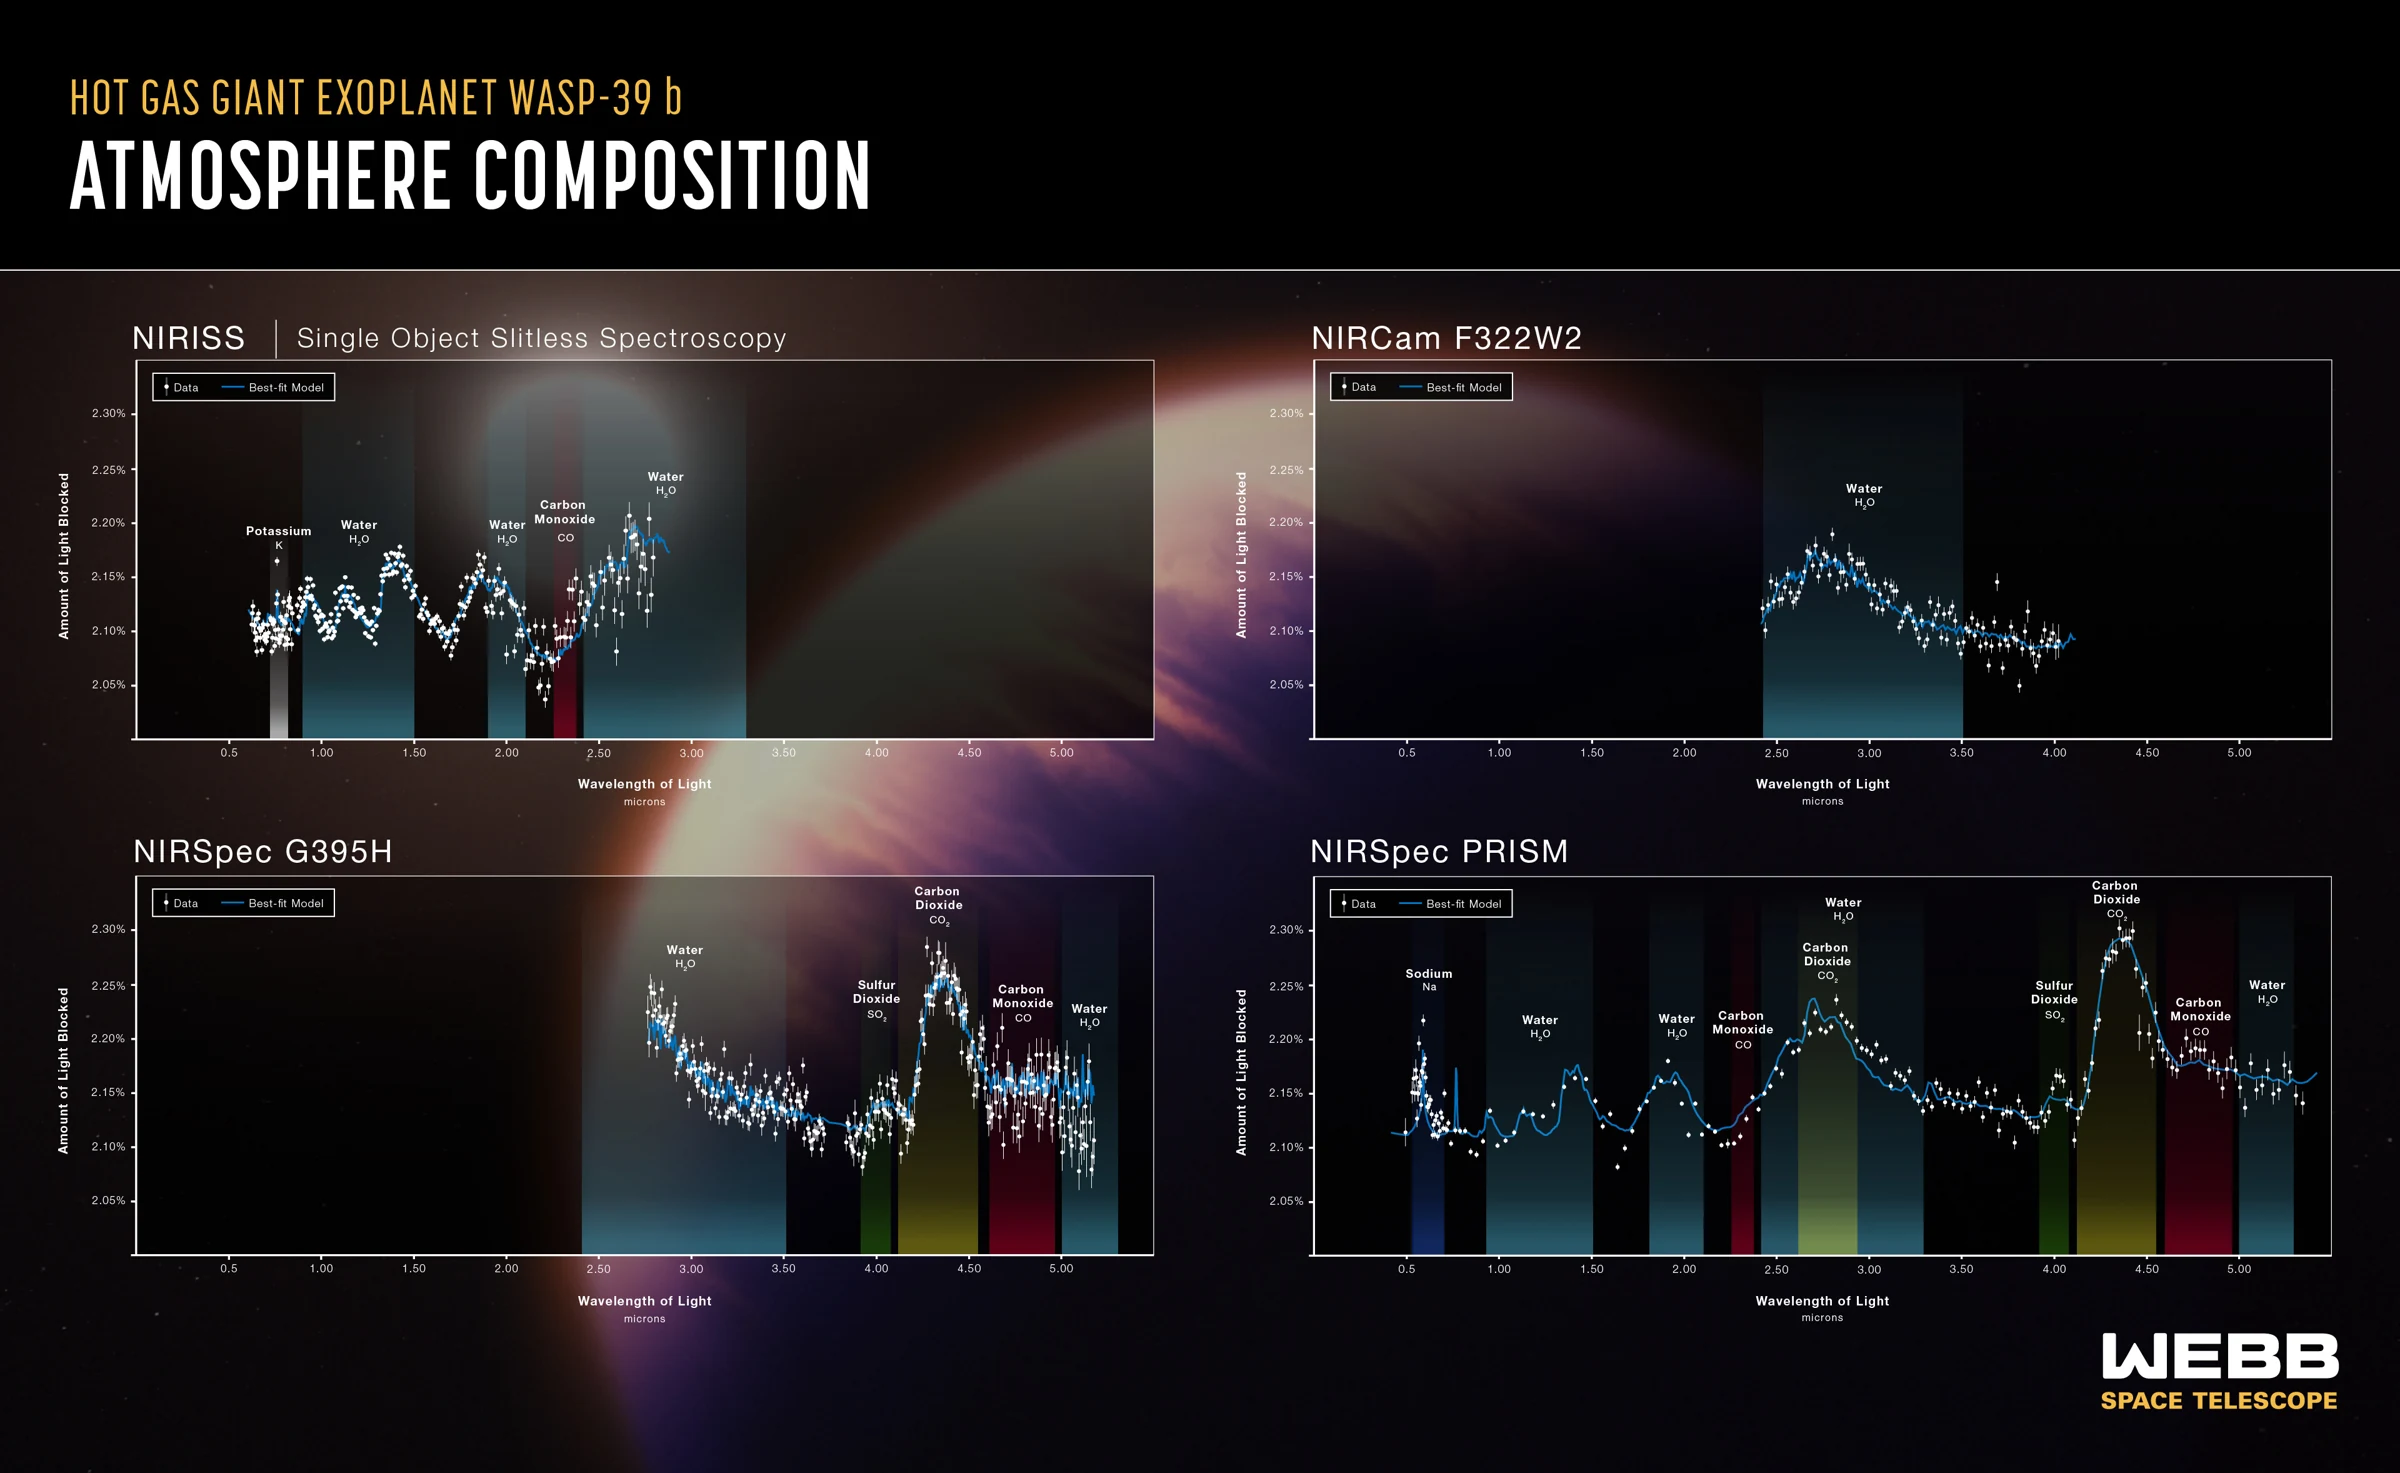
WASP-39 b is a perfect pair to study. It is a hot gas giant about 700 light-years away, roughly the mass of Saturn, orbiting its star in just over four days. In 2022 Webb’s spectrograph found the first clear evidence of carbon dioxide in a planet outside our solar system, as a bump in its spectrum between 4.1 and 4.6 microns (NASA/JPL). Nobody photographed the planet’s surface. The two images below show the difference between the illustration and the evidence.

A useful way to read any illustrated science release is to separate three layers:
- Observed: what did the instrument actually record?
- Inferred: what explanation do researchers draw from those measurements?
- Illustrated: what details were added to help us imagine the scene?
A simulation needs a label too. It is generated from a model, and its value depends on its assumptions, inputs and how well it matches observations. An artist’s impression and a simulation are not interchangeable, even when both look cinematic. The same three layers help when you read claims about the stars themselves; for how astronomers turn a point of light into a measured size, mass and temperature, see How Astronomers Measure Stars.
Would Space Look This Colorful to My Eyes?
Usually not. Your eyes and a scientific camera collect light differently. A telescope can gather light for minutes or hours and use detectors sensitive to wavelengths outside human vision. A finished image also stretches brightness differences that would otherwise be hard to see. Through an eyepiece, most nebulae and galaxies look like faint gray smudges, because our eyes’ color-sensing cells need more light than these objects send us.
There is no single appearance that covers all of space. Bright planets, stars, faint nebulae and distant galaxies create different viewing situations, and distance, brightness and your equipment all matter. Some objects, like the Moon, Jupiter’s cloud belts or Saturn’s rings, do look broadly like their natural-color photos. Faint emission nebulae almost never do.
The Smithsonian National Air and Space Museum’s conversation with telescope imaging specialists makes the central point well: these images can show real recorded light while revealing far more than human vision alone could see. The same is true on the ground of other worlds. Mars rover cameras, for example, often release both a natural-color and a “white-balanced” version of the same scene; see How Do Mars Rovers Navigate? for how their cameras double as navigation tools.
How to Check a Space Image in Five Steps
- 1. Find the original release. A repost can crop away the credit or swap a careful caption for a dramatic claim. Look for the image on the observatory, mission or research institution’s website. A reverse image search often gets you there in seconds.
- 2. Identify the image type. Look for “natural color,” “enhanced color,” “composite,” “simulation,” “artist’s concept” or “illustration.” Check the credit line as well as the headline.
- 3. Check the instrument and wavelengths. A camera name, filter list or color key gives you something concrete to interpret. An infrared image should not be read as ordinary visible color. Webb’s eight-pointed stars are a quick clue to the telescope.
- 4. Check the dates. Observation date, release date and the date of a social post can all be different. A mosaic may draw on more than one observing session.
- 5. Match the picture to the claim. Does the image actually show the object being discussed? A generic illustration of a black hole does not become a photo of a newly reported black hole because someone placed it next to a headline.
A caption that explains its processing gives you more to work with. Missing provenance leaves you with a picture, but not enough information to verify the claim around it.
What About AI-Generated Space Images?
An AI-generated image can be useful as a clearly labeled editorial illustration. It can explain an idea or set a visual mood. It is never evidence that a particular nebula, planet surface or telescope observation looks that way, because no telescope was involved. Generative models have also been trained on millions of processed space images, so their output can look convincingly “NASA-like” while showing nothing real.
Warning signs include impossible detail on an exoplanet’s surface, stars with inconsistent spike patterns, text or logos that dissolve into gibberish, and no observatory, instrument or date anywhere in the caption.
At Dark Cosmic Insights, every image carries a visible label: OBSERVATION for real telescope or spacecraft images, DATA for spectra, maps and measurements, ILLUSTRATION for artist’s concepts and our own diagrams, and an explicit “AI-generated” note on any generated art. The hero image at the top of this article is one of those, and it says so.
Myth vs. Fact: Space Photo Edition
| Myth | Fact |
|---|---|
| If NASA processed it, it’s fake. | Processing turns real measurements into a viewable image. The caption says what was done. |
| False color means the object was invented. | It means colors represent wavelengths our eyes can’t see, mapped in a documented order. |
| Webb images show what you’d see from a spaceship. | Webb sees infrared. Every Webb color image is a translation into visible colors. |
| Star spikes prove the image was edited. | Spikes come from the telescope’s mirror and struts. Webb’s eight-point pattern is its fingerprint. |
| Exoplanet pictures are photos of the planet. | Almost all are artist’s concepts. The evidence is usually a spectrum or a dip in starlight. |
| The Blue Marble is a single snapshot. | The 2002 Blue Marble is a mosaic of months of satellite data. Apollo 17’s 1972 photo is a single snapshot. |
Space Images by the Numbers
- 65,000+: shades of gray each Webb pixel can record (NASA).
- 140 MB to 5 GB: typical size range of a single Webb data file (NASA).
- 29 and 9: filters available on NIRCam and MIRI (NASA).
- 4 to 5: NIRCam filters in a typical composite; 3 to 4 for MIRI (NASA).
- 6: filters used for Webb’s NIRCam Pillars of Creation, from 0.9 to 4.7 microns (ESA/Webb).
- 0.4 to 0.7 microns: roughly the range of light human eyes can see.
- 8: diffraction spikes around bright stars in Webb images, from 18 hexagonal mirror segments and three struts (NASA/STScI).
- About 1 year: typical period before Webb data becomes public for anyone to process (NASA).
- 4.1 to 4.6 microns: where Webb found carbon dioxide in WASP-39 b’s spectrum (NASA/JPL).
Frequently Asked Questions
Are space photos real?
Most are built from real light recorded by telescopes and spacecraft, then processed. Their colors may not match what your eyes would see. Artist’s concepts and simulations are not photos, and good captions say so.
Are NASA photos edited?
Many are processed: calibrated, cleaned of artifacts, aligned, brightened and assigned colors. That is different from inventing content, and NASA’s captions explain the steps.
Are James Webb images real photos?
They start as real infrared observations. The published color pictures translate those measurements into visible colors, usually by combining several filters.
Does false color mean the image is fake?
No. It means display colors stand for wavelengths or measurements that differ from ordinary human vision. The data can still be entirely observational.
Why do raw telescope images look black and white?
Each exposure records the amount of light through one filter, so it displays in grayscale. Raw Webb frames look almost black until the brightness is stretched.
Why do stars in Webb pictures have eight points?
They are diffraction spikes caused by Webb’s hexagonal mirror segments and the struts holding its secondary mirror. Hubble’s design gives four.
How can I tell whether an exoplanet picture is a photograph?
Read the original image page and credit. “Artist’s concept,” “illustration” and “simulation” mean it is not a photo. Almost no exoplanet has been photographed in detail.
Would a nebula look this colorful through a telescope?
Usually not. Most nebulae look faint and gray to the eye, because long exposures and infrared detectors capture far more light and color than our eyes can.
Sources
- NASA. How are Webb’s full-color images made?
- ESA/Webb. Image processing; Usage of ESA/Webb images and videos.
- ESA/Webb (Oct. 19, 2022). Pillars of Creation (NIRCam image), weic2216a; Pillars of Creation (MIRI image), weic2218a.
- NASA. Pillars of Creation (NIRCam); Pillars of Creation (MIRI); Pillars of Creation (NIRCam and MIRI composite).
- NASA/STScI. Webb diffraction spikes explainer (transcript).
- NASA/JPL (Aug. 25, 2022). NASA’s Webb Detects Carbon Dioxide in Exoplanet Atmosphere; ESA/Webb weic2221a and weic2221b.
- NASA. Hot sub-Neptune exoplanet TOI-421 b (illustration).
- NASA Earth Observatory. The Blue Marble: True Color Global Imagery at 1 km Resolution; NASA, Earth from Space: 15 Amazing Things in 15 Years.
- Smithsonian National Air and Space Museum. AirSpace: Space images and the people who make them.
Keep Exploring
See the same nebula through two observatories in Hubble vs. Webb, and how enhanced spacecraft images reveal giant polar storms in Jupiter’s Polar Cyclones vs. Saturn’s Hexagon. For a closer look at Saturn’s six-sided jet stream, our sister site Code of Ascension has a deep dive on the Saturn hexagon, and for a star whose changing appearance puzzled astronomers, see its guide to Betelgeuse; both link back to the NASA and ESA data.
How This Explainer Was Checked
Every technical claim in this article comes from NASA, ESA/Webb, JPL or the Smithsonian, linked above, and was checked against those sources in November 2026. Filter lists and color assignments are taken from the official release pages. Images labeled OBSERVATION are real Webb images; DATA marks published spectra and our data graphics; ILLUSTRATION marks artist’s concepts and original Dark Cosmic Insights diagrams. The hero image is AI-generated and labeled as such. The four Webb visuals are used under ESA/Webb’s CC BY 4.0 reuse policy. To flag a factual or credit issue, contact Dark Cosmic Insights with this article’s title and the source in question.
About The Author
Author: King | Founder of Dark Cosmic Insights
King is the founder of Dark Cosmic Insights, a science storytelling platform exploring the strangest true stories hiding in space, science and AI. Through Dark Cosmic Insights, King digs into NASA, ESA and peer-reviewed research, separates what has been measured from what is still a mystery, and turns real discoveries into clear articles, original data graphics and Shorts that help curious people see the universe more clearly.
Follow the anomaly. Trace the source. 🔭
November 5, 2026